Operating Basics: User Interface
2-70 OTS9100 User Manual
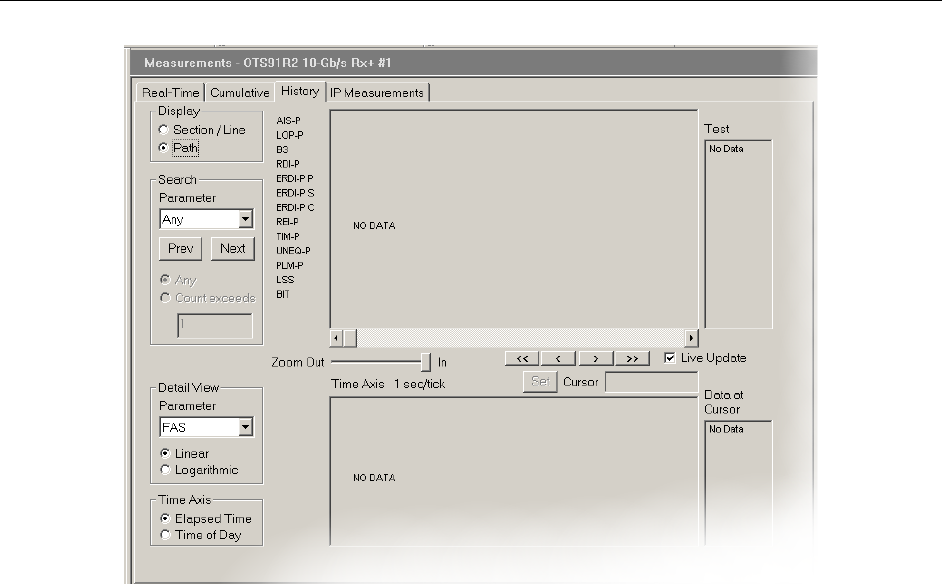
Figure 2-47: Example of Results History Data –Path
The upper window shows a trace for each measurement parameter. A dark rectangle is shown for a
measurement interval during which an errored second occurred (LOS, LOF, LOP, SEF/OOF, TIM, AIS,
RDI, PLM, UNEQ, LSS) or one or more errors were counted (B1, B2, B3, FAS, REI, BIT/TSE).
The lower window shows a bar-graph display (B1, B2, FAS, REI) of the anomaly selected by
the Detail View selector. The display may be linear or logarithmic, and is automatically scaled
based on the maximum value for that parameter.
The Zoom Out/In slider sets the display’s time axis. The limits are 1 second/tick to 1 hour/tick.
The display and the detail view scale are set accordingly.
The Scroll bar scrolls the display horizontally.
The display Time Axis may be set to show elapsed test time or time of day. Elapsed test time
does not accrue when a test is paused; time of day continues.
The Cursor, shown as a colored line on the display, identifies a particular measurement sample.
It may be positioned in several ways:
Incrementally, by moving it with the four Cursor buttons
Directly, by clicking the mouse in one of the data windows.
Directly, by entering a time value in the Cursor field and clicking the Set button.
When the Time Axis display is set to Elapsed Time, the cursor position may be entered:
In seconds, e.g., 135
In hours:minutes:seconds, e.g., 2:15 or 0:2:15
In days, hours, minutes, seconds, e.g., 3d 4h 2m 15s