1-3
Introduction
Introduction
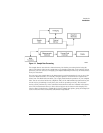
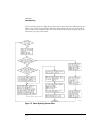
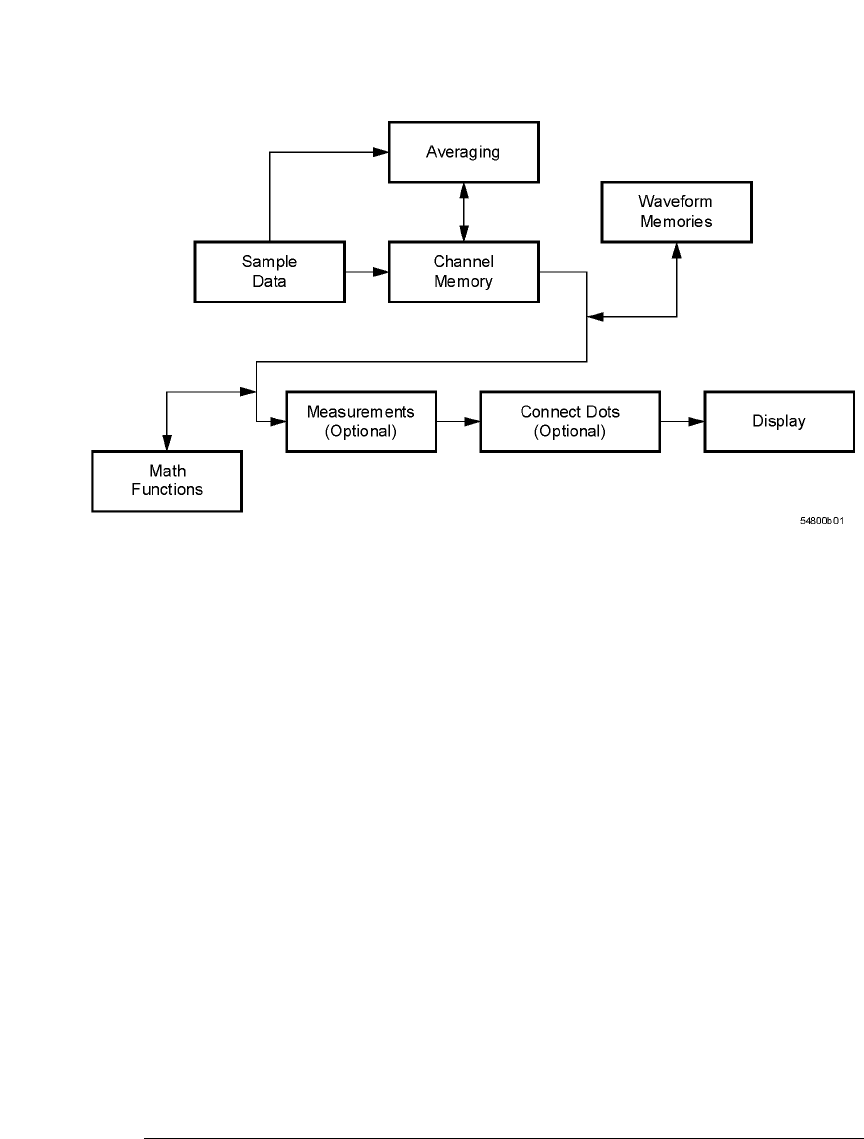
Figure 1-1. Sample Data Processing
The sample data is stored in the channel memory for further processing before being dis-
played. The time it takes for the sample data to be displayed depends on the number of post
processes you have selected. Averaging your sampled data helps remove any unwanted noise
from your waveform.
You can store your sample data in the instrument’s waveform memories for use as one of the
sources in Math functions, or to visually compare against a waveform that is captured at a
future time. The Math functions allow you to apply mathematical operations on your sampled
data. You can use these functions to duplicate many of the mathematical operations that your
circuit may be performing to verify that your circuit is operating correctly. The measure-
ments section performs any of the automated measurements that are available in the instru-
ment. The measurements that you have selected appear at the bottom of the display. The
Connect Dots section draws a straight line between sample data points, giving an analog look
to the waveform. This is sometimes called linear interpolation.


