11-2
Display Commands
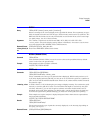
CGRade:LEVels?
Display Commands
The DISPlay subsystem controls the display of data, markers, text, graticules, and the use of
color. You select the display mode using the ACQuire:TYPE command. Select the number of
averages using ACQuire:COUNt.
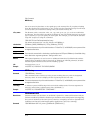
CGRade:LEVels?
Query :DISPlay:CGRade:LEVels? [CHANnel<N> | FUNCtion<N> | CGMemory]
This query returns the range of hits represented by each color for the specified source. If no
source is specified, the values for the first database signals turned on is returned. Fourteen
values are returned, representing the minimum and maximum count for each of seven colors.
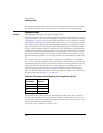
The values are returned in the following order:
• Greatest intensity color minimum
• Greatest intensity color maximum
• Next greatest intensity color minimum
• Next greatest intensity color maximum
• . . . .
• Least intensity color minimum
• Least intensity color maximum
Returned Format [:DISPlay:CGRade:LEVels] <color format><NL>
<color format> <intensity color min / max> is an integer value from 0 to 63,488.
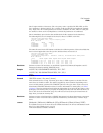
Example The following example gets the range of hits represented by each color.
10 DIM Setting$[50] !Dimension variable
20 OUTPUT 707;":DISPLAY:CGRADE:LEVELS?"
30 ENTER 707;Cgrade$
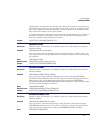
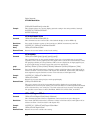
CONNect
Command :DISPlay:CONNect {{ON | 1}|{OFF | 0}}
When enabled, :DISPlay:CONNect draws a line between consecutive waveform data points.
This is also known as linear interpolation. This command has no effect on color grade or gray
scale displays.
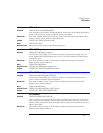
Example This example turns on the connect-the-dots feature.
10 OUTPUT 707;":DISPLAY:CONNECT ON"
Query :DISPlay:CONNect?
The query returns the status of the connect-the-dots feature.
Returned Format [:DISPlay:CONNect] {ON | OFF}<NL>


