


19-2
S-Parameter Commands
S-Parameter Commands
This subsystem provides support for the S-parameter features, which are part of Option 202,
Enhanced Impedance and S-Parameter software. The S-parameter graph displays the S-
parameters that have been transformed from the TDR/TDT time domain data to the fre-
quency domain.
To turn S-parameter analysis on and off, use “TDRSparam” on page 19-3. Use the :SPARame-
ter:MAGGraph commands in this chapter to control the scaling of the S-parameters graph.
Use the :SPARameter:MARKer commands to place markers on the graph. S-parameter data
(including phase information) can be saved to files using “SPARameter:SAVE” on page 10-8.
The Fourier transform of the time-domain step response includes trace data starting from the
reference plane.
Restrictions The S-Parameter subsystem requires TDR mode with Option 202, Enhanced Impedance and
S-Parameter software. Instrument software revision A.06.00 and above.
Windowing By adjusting the time span and reference plane position, you can use windowing as a time fil-
tering technique to measure the frequency response at a specific location of a test device.
Only the information in the window is transformed allowing you to isolate the physical inter-
connects of a device and view them individually in frequency domain. Adjusting the time
scale (time-per-division) will impact the maximum frequency range and frequency resolu-
tion.
Frequency Span The maximum usable frequency span is always set for the current conditions when the graph
is displayed. The frequency span is dependent upon the time span used and the points-per-
waveform setting. The time span (acquisition interval) for the Fourier transform equals the
time-per-division setting multiplied by the number of display graticules (divisions) that the
trace occupies.
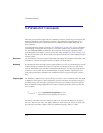
Consider the situation where the reference plane is at or beyond the display's left edge. In
this case, data from the entire ten display divisions is used. If the time scale is 10 ns/div and
the points-per-waveform setting is 1024, the maximum frequency will be 5.1 GHz.
F
maximum
points-per-waveform
2time/division()display divisions()
--------------------------------------------------------------------------------------------------=