25-4
Waveform Commands
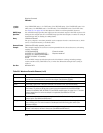
COUNt?
20 OUTPUT 707;":WAVEFORM:BYTEORDER?"
30 ENTER 707;Setting$
COUNt?
Query :WAVeform:COUNt?
This query returns the fewest number of hits in all of the time buckets for the currently
selected waveform. For the AVERAGE waveform type, the count value is the fewest number
of hits for all time buckets. This value may be less than or equal to the value specified with
the ACQuire:COUNt command.
For the NORMAL, RAW, INTERPOLATE, and VERSUS waveform types, the count value
returned is one, unless the data contains holes (sample points where no data is acquired). If
the data contains holes, zero is returned.
Returned Format [:WAVeform:COUNt] <N><NL>
<N> An integer. Values range from 1 to 262144 for NORMal, RAW, or INTerpolate types and from 1
to 32768 for VERSus type.
Example 10 DIM Count$[50] !Dimension variable
20 OUTPUT 707;":WAVEFORM:COUNT?"
30 ENTER 707;Count$
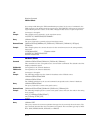
DATA
Command :WAVeform:DATA <block_data>[,<block_data>]
This command transfers waveform data to the analyzer over GPIB and stores the data in a
previously specified waveform memory. The waveform memory is specified with the WAVe-
form:SOURce command. Only waveform memories may have waveform data sent to them.
The format of the data being sent must match the format previously specified by the wave-
form preamble for the destination memory.
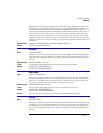
VERSus data is transferred as two arrays. The first array contains the data on the X axis, and
the second array contains the data on the Y axis. The two arrays are transferred one at a time
over GPIB in a linear format. There are n data points sent in each array, where n is the num-
ber in the points portion of the preamble.
CGRade data is transferred as a two dimensional array, 321 words high and 451 words wide.
The array corresponds to the graticule display, where each word is a sample hit count. The
array is transferred column by column, starting with the upper left corner of the graticule.
The full-scale vertical range of the A/D converter will be returned with the data query. You
should use the Y-increment, Y-origin, and Y-reference values to convert the full-scale vertical
ranges to voltage values. You should use the Y-range and Y-display values to plot the voltage
values. All of these reference values are available from the waveform preamble. Refer to
"Conversion from Data Value to Units" earlier in this chapter.
NOTE This command operates on waveform data which is not compatible with Jitter Mode. Do not use this command
in Jitter Mode. It generates a “Signal or trigger source selection is not available” error.
<block_data> Binary block data in the # format.
Example This example sends 1000 bytes of previously saved data to the analyzer from the array, Set.


