


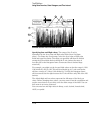
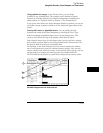
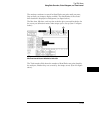

The analyzer continues to search for Start/End event pairs until you press
Stop or until you change a display variable. The distribution of the events’
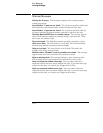
time duration is displayed as histograms (see figure below).
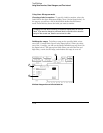
The Max time, Min time, and Avg time statistics give you useful statistics for
the event you defined no matter what ranges you’ve set up (item 1 in figure
below).
SPA Time Interval Menu with Statistics Called Out
The Total samples field shows the number of Start/End event pairs found by
the analyzer, whether they are covered by the ranges or not (item 2 in figure
above).
2
1
The SPA Menu
Using State Overview, State Histogram, and Time Interval
11-29