


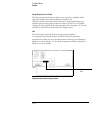
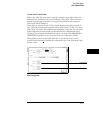
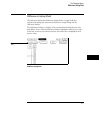

X axis and Y axis Fields
Either axis of the XY chart can be scaled by using the associated vertical or
horizontal min (minimum) or max (maximum) value fields. When selected, a
pop-up keypad appears in which you specify the minimum and maximum
values that will be displayed.
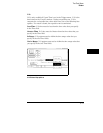
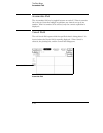
When State is selected for the X axis, sample locations are plotted on the X
axis. The min and max state locations are specified in the "X axis: Plot from
State" field. For State, the minimum and maximum values that are selectable
depend upon the memory depth you specified in the Configuration menu.
For labels, the minimum and maximum values can range from 00000000H to
FFFFFFFFH regardless of axis, because labels are restricted to 32 bits.
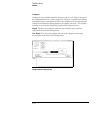
When plotting Label versus Label, both the Y axis and the X axis can be
scaled. Charted memory locations are selectable in the "Plot from State" field
for the X axis.
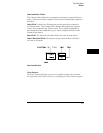
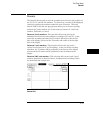
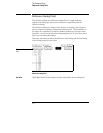
Axes Scaling Fields
X axis fields
Y axis fields
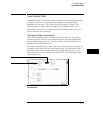
The Chart Menu
Axis Control Field
8–17