


469Performance monitoring and tuning
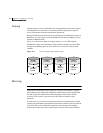
Performance monitoring
an operation makes it possible to measure the impact of that particular
operation.
The following is an example of output produced using the vxstat command:
OPERATIONS BLOCKS AVG TIME(ms)
TYP NAME READ WRITE READ WRITE READ WRITE
vol blop 0 0 0 0 0.0 0.0
vol foobarvol 0 0 0 0 0.0 0.0
vol rootvol 73017 181735 718528 1114227 26.8 27.9
vol swapvol 13197 20252 105569 162009 25.8 397.0
vol testvol 0 0 0 0 0.0 0.0
Additional volume statistics are available for RAID-5 configurations.
For detailed information about how to use
vxstat, refer to the vxstat(1M)
manual page.
Using performance data
When you have gathered performance data, you can use it to determine how to
configure your system to use resources most effectively. The following sections
provide an overview of how you can use this data.
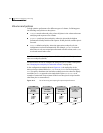
Using I/O statistics
Examination of the I/O statistics can suggest how to reconfigure your system.
You should examine two primary statistics: volume I/O activity and disk I/O
activity.
Before obtaining statistics, reset the counters for all existing statistics using the
vxstat -r command. This eliminates any differences between volumes or disks
due to volumes being created, and also removes statistics from boot time (which
are not usually of interest).
After resetting the counters, allow the system to run during typical system
activity. Run the application or workload of interest on the system to measure
its effect. When monitoring a system that is used for multiple purposes, try not
to exercise any one application more than usual. When monitoring a time-
sharing system with many users, let statistics accumulate for several hours
during the normal working day.
To display volume statistics, enter the
vxstat command with no arguments. The
following is a typical display of volume statistics:
OPERATIONS BLOCKS AVG TIME(ms)
TYP NAME READ WRITE READ WRITE READ WRITE
vol archive 865 807 5722 3809 32.5 24.0
vol home 2980 5287 6504 10550 37.7 221.1
vol local 49477 49230 507892 204975 28.5 33.5
vol rootvol 102906 342664 1085520 1962946 28.1 25.6
vol src 79174 23603 425472 139302 22.4 30.9
vol swapvol 22751 32364 182001 258905 25.3 323.2