


467Performance monitoring and tuning
Performance monitoring
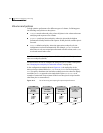
Note: To improve performance for read-intensive workloads, you can attach up
to 32 data plexes to the same volume. However, this would usually be an
ineffective use of disk space for the gain in read performance.
Performance monitoring
As a system administrator, you have two sets of priorities for setting priorities
for performance. One set is physical, concerned with hardware such as disks and
controllers. The other set is logical, concerned with managing software and its
operation.
Setting performance priorities
The important physical performance characteristics of disk hardware are the
relative amounts of I/O on each drive, and the concentration of the I/O within a
drive to minimize seek time. Based on monitored results, you can then move the
location of subdisks to balance I/O activity across the disks.
The logical priorities involve software operations and how they are managed.
Based on monitoring, you may choose to change the layout of certain volumes to
improve their performance. You might even choose to reduce overall
throughput to improve the performance of certain critical volumes. Only you
can decide what is important on your system and what trade-offs you need to
make.
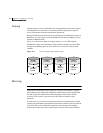
Best performance is usually achieved by striping and mirroring all volumes
across a reasonable number of disks and mirroring between controllers, when
possible. This procedure tends to even out the load between all disks, but it can
make VxVM more difficult to administer. For large numbers of disks (hundreds
or thousands), set up disk groups containing 10 disks, where each group is used
to create a striped-mirror volume. This technique provides good performance
while easing the task of administration.
Obtaining performance data
VxVM provides two types of performance information: I/O statistics and I/O
traces. Each of these can help in performance monitoring. You can obtain I/O
statistics using the
vxstat command, and I/O traces using the vxtrace
command. A brief discussion of each of these utilities may be found in the
following sections.