


April 2004
9-10 Servicing the PT878GC
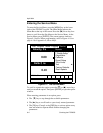
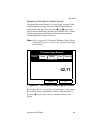
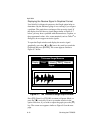
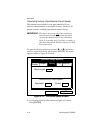
Displaying the Receive Signal in Graphical Format
Used chiefly for diagnostic purposes, the Graph option helps to
determine why the thickness gauge is not working if you suspect
a problem. The graph shows an image of the acoustic signal. If
the display does not show a signal image similar to Figure 9-7
below, you may have a problem with the transducer, couplant, or
the programmed values. Also, some materials (such as Teflon
®
or
fiberglass) do not support acoustic signals.
To open the Graph window and display the receive signal
graphically, press the [
W ] or [X] arrow key until you reach the
Graph tab and press
[ENTER]. The screen appears similar to
Figure 9-7 below.
Figure 9-7: The Thickness Gauge Graph Window
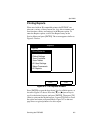
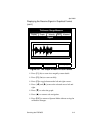
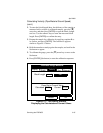
Press
[F2] (Cancel) or [F3] (OK) to return to Operate Mode, or
press the [
X] arrow key to move to another window in the
option. However, if you wish to adjust the graph, press the [
T]
key. The screen now appears similar to Figure 9-8 on the next
page.
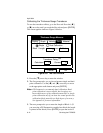
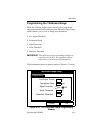
Display
Thickness Gauge Measure
Cancell
OK
Velocity
Graph
Zero
Signal
Material