


April 2004
6-6 Displaying and Configuring Data
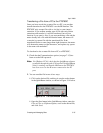
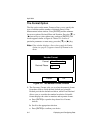
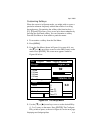
The Limits Option (cont.)
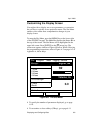
4. The first prompt asks for the minimum value shown in the
graph.
a. Press
[ENTER] to open the text box.
b. Use the numeric keys to enter the desired value.
c. Press
[ENTER] to confirm the value.
5. Repeat the procedure in step 5 to enter the maximum value.
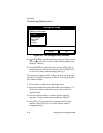
A line graph involves two more prompts.
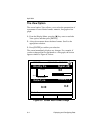
6. The next prompt asks for the display interval.
a. Press
[ENTER] to open the text box. Use the numeric keys
to enter the desired number. Press
[ENTER] to confirm the
value.
b. The second box asks for the interval in terms of seconds,
minutes, hours, or days. Press
[ENTER] to open the drop-
down menu, and then press the [
T] or [S] keys to move
to the desired parameter. Press
[ENTER] to confirm the
entry.
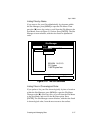
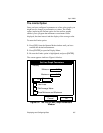
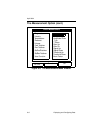
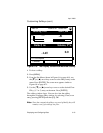
7. The final three prompts ask for details of the graph
configuration: if you want to use lines, plot the average value,
or show the minimum and maximum values. Press the [
T]
key to step through each value, and press
[ENTER] to add a
given detail as part of the graph.
8. When you have configured the graph, press
[F3], OK, to
confirm the graph settings.
The screen returns to Operate Mode, and displays any changes.