


73
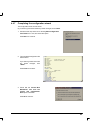
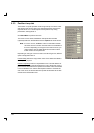
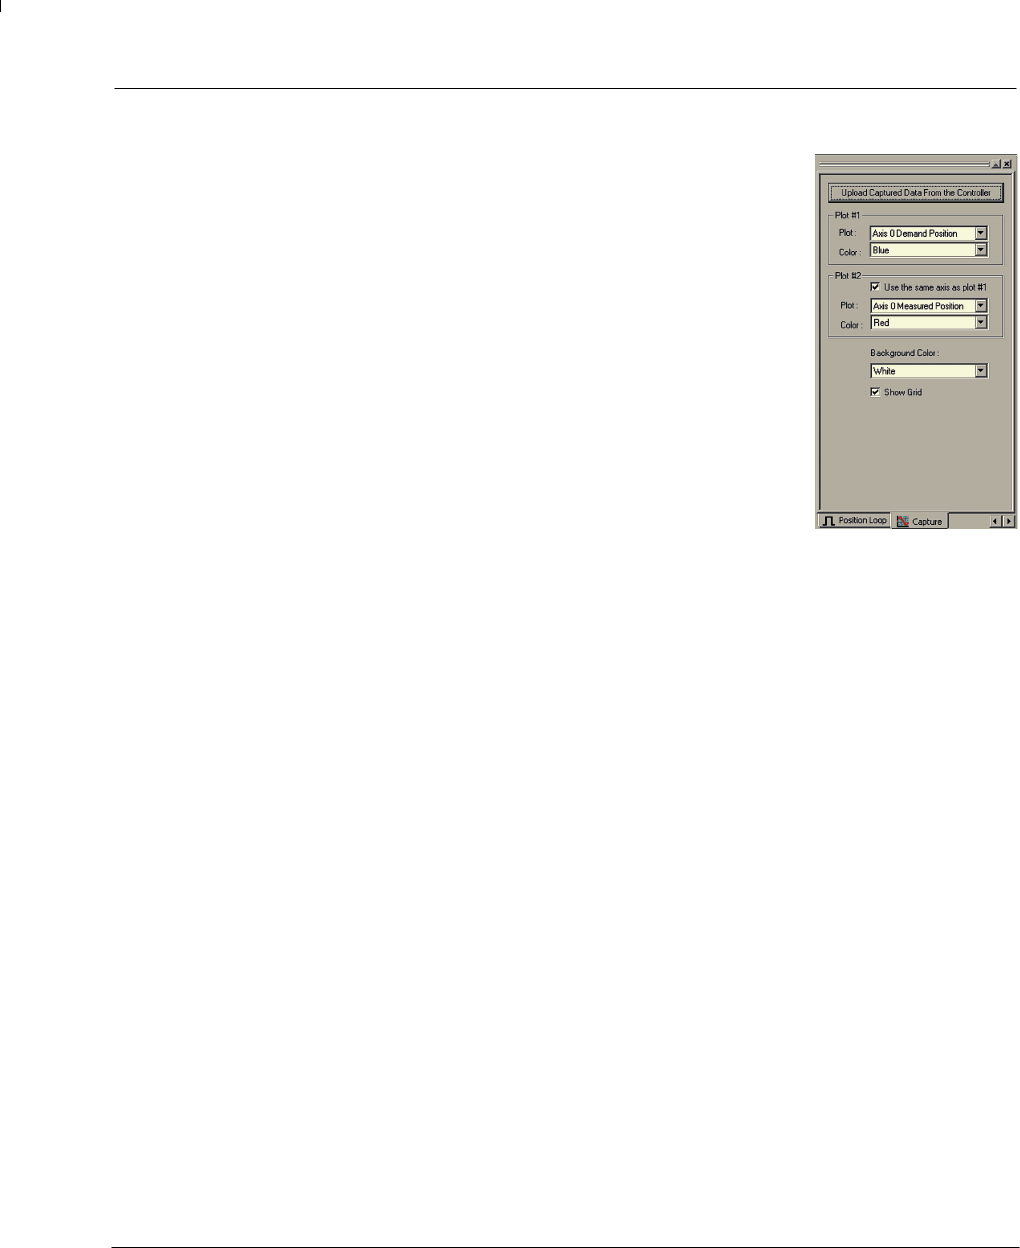
5.3.4 Capture tab
Each time a speed or position test move is performed using WorkBench,
the data from the move is automatically captured and uploaded in to
WorkBench. The Capture tab allows you to select the type of plot produced
from the captured data. Click in the appropriate boxes to select the
required data.
The Plot #1 and Plot #2 frames allow you to select which parameter(s) to
show on the graph and the color of the traces. Plot #2 is only available
after a Position move has been performed.
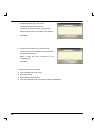
Normally, the graph will automatically scale itself to show the largest
maximum and minimum captured values for the selected plot types.
However, the Use the same axis as plot #1 check box forces the two
traces to be plotted using the scaling required for plot #1. This allows the
two sets of data to be compared with each other more easily.
The background color of the graph can be changed using the Background
Color drop down box, and the grid can be turned on or off using the Show
Grid check box. The Upload Captured Data From the Controller button
allows you to manually upload the data.