


2-27
Using the Instrument
Analyzing Measurement Data
Analyzing Measurement Data
This section provides advice and information on the following analyzer func-
tions that allow you to analyze the measured amplitude wavelength data.
• Tips for Using Traces and Markers
• Measuring the Delta between Traces
• Using Trace Math to Measure Wavelength Drift
Tips for Using Traces and Markers
The analyzer provides the ability to display up to six traces with up to four
markers. Knowing a few tips makes trace and marker manipulation much eas-
ier. Refer to “Traces” on page 3-95, “Marker BW” on page 3-37, “Marker Search
Menu” on page 3-38, “Marker Setup” on page 3-39, and “More Marker Func-
tions” on page 3-45.
• Markers are always placed on the currently selected active trace. Therefore,
use the Active Trace function to activate the desired trace, then select an active
marker to be placed on that trace.
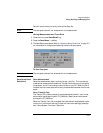
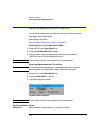
• When multiple markers are currently used on multiple traces, the Marker Sta-
tus area (located at the top of the display) makes it easy to identify the state of
each marker.
Information provided for each marker includes:
• Wavelength
• Amplitude
• The trace associated with the marker.
For example, if marker 1 is on Trace A then the annotation will show
Mkr 1 (A).
In addition, if there are two markers on, then the delta of the wavelength and
amplitude for the two different markers is also displayed. For example, Mkr