


4-12 Chapter 4: Built-In Images
Model 801GC, 801GF & 801GX¥Rev. X1
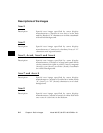
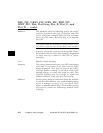
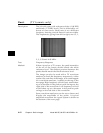
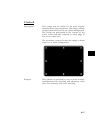
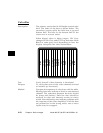
Burst (TV formats only)
Description: The left side start with reference white (+100 IRE)
and black (+7.5 IRE) levels. This is followed by six
bursts of sine waves. Each burst is at a different
frequency forming vertical lines of various widths.
The frequencies, going from left to right, are 0.5, 1,
2, 3, 3.58 and 4.43 MHz.
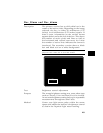
Test: Frequency Response
Method: When viewed on a TV screen, the peak intensities
of the all of the bursts should match the white
reference level. The darkest portions between the
peaks should match the black reference level.
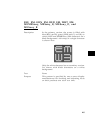
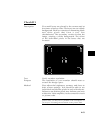
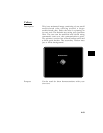
The image can also be used with a TV waveform
analyzer to check the frequency response of a video
system. One scan line of the image, as it would appear
on a waveform analyzer, is shown at the top of the
next page. High frequency roll-off (loss) would show
up as a decrease in the peak-to-peak swings on the
right side of the waveform. Low frequency roll-off
would show up as a decrease in the peak-to-peak
swings on the left side of the waveform.
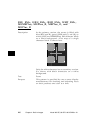
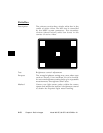
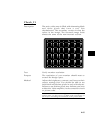
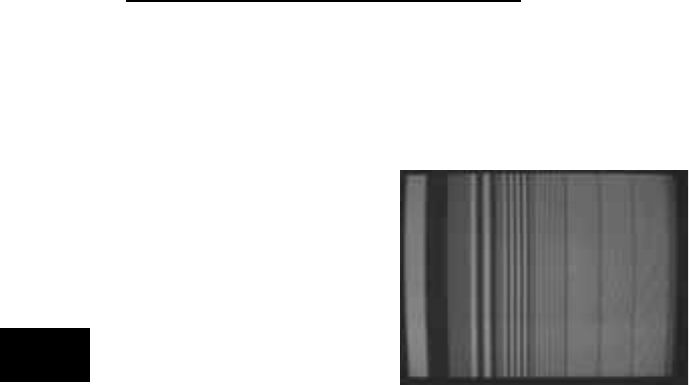
Some waveform analyzers can be set to detect and
display the amplitude of the peaks. A typical
amplitude waveform for a good system is shown at
the bottom of the next page.