


4 - 16 92B/96B/99B/105B Users Manual
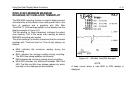
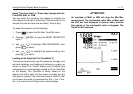
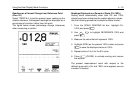
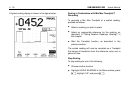
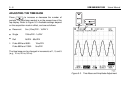
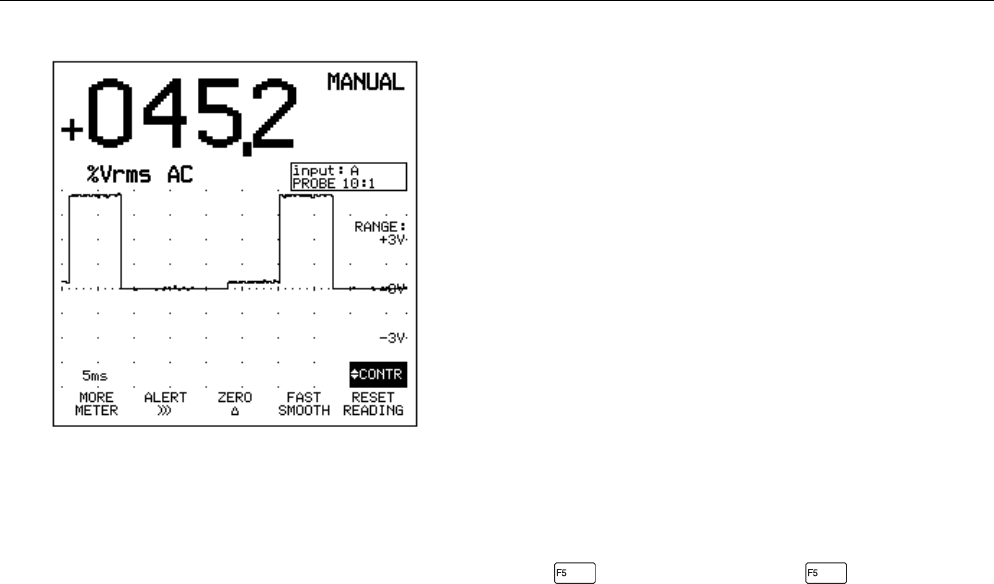
A typical scaling display is shown in the figure below: Scaling in Combination with Min Max Trendplot™
Recording
To generate a Min Max Trendplot of a scaled reading,
proceed as follows:
•
Select a reading you want to scale.
•
Select an appropriate reference for the reading, as
described in "Taking Relative Readings (Scaling)" in
this chapter.
•
Start the Trendplot function, as described in the
previous section.
The scaled reading will now be recorded as a Trendplot
that shows all deviations from the reference value over a
period of time.
Stop Scaling
To stop scaling do one of the following:
•
Choose another function.
•
Highlight SCALE READING in the More window, press
, highlight "off", and press .