


Measuring Examples 7 - 3
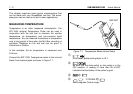
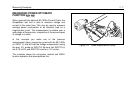
Move the slide switch on the probe to the °C position.
The actual air temperature appears on the display.
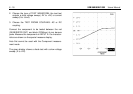
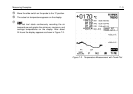
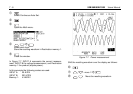
The test tool starts continuously recording the air
temperature and graphs the minimum, maximum, and
average temperatures on the display. After about
24 hours the display appears as shown in Figure 7-2.
Figure 7-2. Temperature Measurement with Trend Plot