


Using the Dual Display Mode Functions 4 - 9
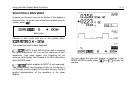
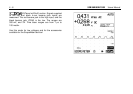
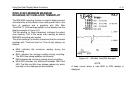
DISPLAYING MINIMUM MAXIMUM
READINGS WITH RELATED TRENDPLOT
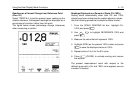
The MIN MAX recording function is used to display several
characteristics of the present main reading over time in the
form of readings and a graphical plot (Min Max
TrendPlot™). Five readings appear on the display (see the
display example in Figure 4-3).
The top reading (in large characters) indicates the actual
main reading. This is the same main reading as before
MIN/MAX recording was started.
The other readings (in smaller characters) are the recorded
readings with 'Time from start' or 'Time of day' stamps, as
follows:
•
MAX indicates the maximum reading during the
recording.
•
AVG indicates the average reading during recording.
The AVG time stamp updates continuously.
•
MIN indicates the minimum reading during recording.
•
MAX-MIN indicates the difference between MAX and
MIN. The Max and Min time stamps update only when
new high or low readings are encountered.
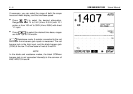
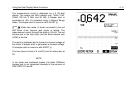
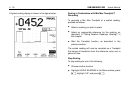
Figure 4-3. Min Max TrendPlot Example
NOTE
A beep occurs when a new MAX or MIN reading is
displayed.