Appendix B: Algorithms
Appendices
AĆ8
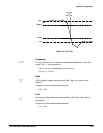
2. It splits the histogram into two sections at the halfway point between Min
and Max (also called Mid).
3. The level with the most points in the upper histogram is the High value,
and the level with the most points in the lower histogram is the Low
value. (Choose the levels where the histograms peak for High and Low.)
If Mid gives the largest peak value within the upper or lower histogram,
then return the Mid value for both High and Low (this is probably a very
low amplitude waveform).
If more than one histogram level (bin) has the maximum value, choose
the bin farthest from Mid.
This algorithm does not work well for twoĆlevel waveforms with greater than
about 100% overshoot.
HighRef, MidRef, LowRef, Mid2Ref
The user sets the various reference levels, through the Reference Level
selection of the Measure menu. They include:
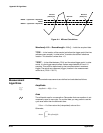
HighRef Ċ the waveform high reference level. Used in fall time and rise
time calculations. Typically set to 90%. You can set it from 0% to 100% or to
a voltage level.
MidRef Ċ the waveform middle reference level. Typically set to 50%. You
can set it from 0% to 100% or to a voltage level.
LowRef Ċ the waveform low reference level. Used in fall and rise time
calculations. Typically set to 10%. You can set it from 0% to 100% or to a
voltage level.
Mid2Ref Ċ the middle reference level for a second waveform (or the seĆ
cond middle reference of the same waveform). Used in delay time calculaĆ
tions. Typically set to 50%. You can set it from 0% to 100% or to a voltage
level.
Other Variables
The oscilloscope also measures several values itself that it uses to help
calculate measurements.
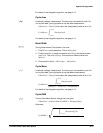
RecordLength Ċ is the number of data points in the time base. You set it
with the Horizontal menu Record Length item.
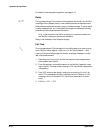
Start Ċ is the location of the start of the measurement zone (XĆvalue). It is
0.0 samples unless you are making a gated measurement. When you use
gated measurements, it is the location of the left vertical cursor.


