TDS 620A, 640A & 644A User Manual
AĆ7
Appendix B: Algorithms
TDS 600A Digitizing Oscilloscopes can take 25 automatic measurements. By
knowing how they make these calculations, you may better understand how
to use your TDS 600A and how to interpret your results.
TDS 600A Digitizing Oscilloscopes use a variety of variables in their calculaĆ
tions. These include:
High, Low
High is the value used as the 100% level in measurements such as fall time
and rise time. For example, if you request the 10% to 90% rise time, then the
oscilloscope will calculate 10% and 90% as percentages with High repreĆ
senting 100%.
Low is the value used as the 0% level in measurements such as fall time and
rise time.
The exact meaning of High and Low depends on which of two calculation
methods you choose from the HighĆLow Setup item of the Measure menu.
These are MinĆmax and Histogram.
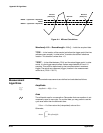
MinĆMax Method Ċ defines the 0% and the 100% waveform levels as the
lowest amplitude (most negative) and the highest amplitude (most positive)
samples. The minĆmax method is useful for measuring frequency, width, and
period for many types of signals. MinĆmax is sensitive to waveform ringing
and spikes, however, and does not always measure accurately rise time, fall
time, overshoot, and undershoot.
The minĆmax method calculates the High and Low values as follows:
High = Max
and
Low = Min
Histogram Method Ċ attempts to find the highest density of points above
and below the waveform midpoint. It attempts to ignore ringing and spikes
when determining the 0% and 100% levels. This method works well when
measuring square waves and pulse waveforms.
The oscilloscope calculates the histogramĆbased High and Low values as
follows:
1. It makes a histogram of the record with one bin for each digitizing level
(256 total).
Measurement
Variables


