


Defining the Time Interval ranges
Before changing the ranges from
their default values, you may want to press Run and acquire some data.
From this initial run, the Maximum (Max), Minimum (Min), and Average
(Avg) statistics on the display will help you choose the appropriate set of
Time Interval ranges.
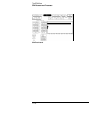
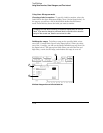
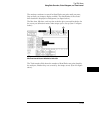
To define the ranges, select the fields for the lower and upper limits (item 2
in the figure on the previous page) and enter the limits of the range. The
ranges do not need to be contiguous, but if you leave gaps between the
ranges, critical data may be missed. Also, if you overlap ranges, data may be
counted multiple times and present a misleading histogram.
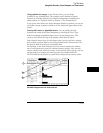
Using Auto-range
To quickly set up all 8 time interval ranges, select
the Auto-range field. Enter the minimum time and maximum time for all
8 ranges combined. Then, when you select Log Scale or Linear Scale, all
8 ranges will be scaled accordingly between the Minimum and Maximum
times. See item 3 in the figure on the previous page for the Auto-range
pop-up. Common boundaries of adjacent ranges are not considered
overlapped. Values that fall on the common boundary will be included in
the highest range.
A fast way to set up the Time Interval display is to define your Start and End
events and select
R
un using the default ranges. Select Repetitive Run mode.
After accumulating data for a while, press Stop. Then select Auto-range and
enter the Min time and Max time display statistics in the Auto-range
Minimum time and Maximum time fields. When you select Log Scale or
Linear Scale, the ranges will be defined automatically.
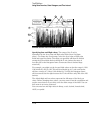
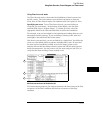
Interpreting the histogram display
As the analyzer samples the data,
it searches for Start/End event pairs. One event pair is considered one
sample. The time value for each event pair is compared to each defined
time interval range. The range’s count is incremented if the time value
falls within that range.
The SPA Menu
Using State Overview, State Histogram, and Time Interval
11-28