•
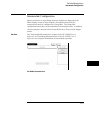
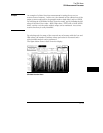
The Y axis is the relative number of occurrences in each bucket.
•
Maximum value of the Y axis is constantly updated to reflect the number
of occurrences in the bucket that has the most occurrences, and is
displayed as "Max count."
•
The total number of states sampled for the selected label is presented as
Total count. This includes states that may be outside the user-specified
X axis range.
•
Two markers are available on the X axis to determine the range of a
bucket and number of occurrences in any bucket.
•
Choice of base for a specified label is user-definable.
State Histogram
The State Histogram mode displays states that occur
within user-defined ranges of a label. State Histogram is available on any
label defined in the Format Specification.
•
Maximum number of ranges is 11.
•
Other States included/excluded is available and displays a histogram of all
states not covered by the user-defined ranges.
•
You can trace All States or patterned Qualified States.
•
Total samples displays the total number of occurrences in all displayed
ranges.
•
Choice of base for specified label is user-definable.
Time Interval
The Time Interval mode displays time intervals between
user-defined start and end events.
•
Start and end events can be defined over all labels defined in the Format
Specification.
•
10 ns is the minimum sample period and time interval resolution.
•
The maximum number of time interval ranges is 8.
•
Time interval range size is 10 ns to 9,999,999 seconds.
•
Calculated statistics provides Maximum time, Minimum time, Average
time, and Total number of time intervals sampled (one time interval
defined to be a paired start/end event).
•
Auto-range feature automatically scales the eight time intervals over
maximum and minimum times using a logarithmic scale or linear scale.
•
Choice of base for labels is user-definable.
The SPA Menu
What is System Performance Analysis?
11-5


