


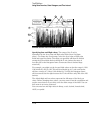

Interpreting the histogram display
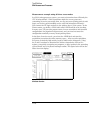
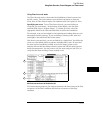
Select Run Repetitive to start the
State Histogram acquisition. The relative activity over the ranges you
defined is displayed as histograms (see the figure on the previous page).
The total samples field shows the total number of data samples displayed
in all of the ranges. The number of samples for each range is displayed to
the left of each histogram.
The percentage amounts of the histograms total 100% (note the scale at the
bottom of the display). If they add up to more than 100%, you have
overlapped two or more ranges, and the data samples are being counted in
multiple ranges.
The analyzer will continue to sample, sort the data, and update the display
until you press Stop or until you change a display variable.
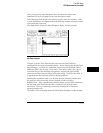
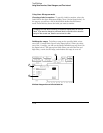
Other States included/excluded
The histograms show the relative
distribution of activity over the ranges you have defined. In most cases,
the ranges will not cover the full range of the label you chose to monitor.
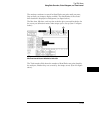
To view the activity over the entire range of the label, including activity not
covered by the ranges, select the Other States field and change it to included
(item 3 in the figure on the previous page). Another histogram bar called
"other" will appear at the bottom of the display. This will show activity not
covered by the ranges. You can toggle included/excluded if the analyzer is
running since it only affects the display and not the accumulated data that
has been acquired.
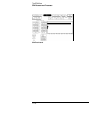
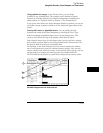
Note that changing between included and excluded changes the absolute
sizes of the histograms. Unless you have defined overlapping ranges, the
total percentage size of the all the range histograms plus the histogram for
other should equal 100%.
The SPA Menu
Using State Overview, State Histogram, and Time Interval
11-26