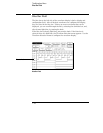
The Chart Menu
Chart is a software post-processing feature that provides the ability to
build XY graphs of label activity using state data. The Chart menu is
only available when an analyzer is set to State or State Compare type.
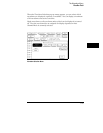
The Y axis of the Chart mode always represents data values for a
specified label. You can select whether the X axis represents states
(rows in the Listing menu) or the data values for another label.
Chart Post-Processing Features
• When the X axis is set to State, X and O markers are available
which can be used to search for specific data patterns or document
time intervals of interest in timing mode. X and O markers can also
gather statistics on the time between specific patterns in timing
mode.
• Marker placement is synchronized with the Listing and Waveform
menus.
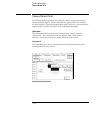
• An accumulate mode is available that allows the chart display to
build up over several runs.
• You can set a range of data to plot which scales both the axes to
selectively view only data of interest.
• You can generate XY plots of Label versus Label or Label versus
State.
8–2


