Using the Dual Display Mode Functions 4 - 11
Using 'Time from start' or 'Time of day' stamps with the
Fluke 96B, 99B, or 105B
You can select the recording time stamps to indicate the
time relative to the start of recording ('Time from start') or to
indicate the internal clock time and date ('Time of day').
To make this selection, do the following:
1. Press to open the Min Max TrendPlot menu.
2. Press (MORE) to open the MORE TRENDPLOT
menu.
3. Use to highlight TIME REFERENCE; then
press to select.
4. Use to highlight the desired setting; then
press to select.
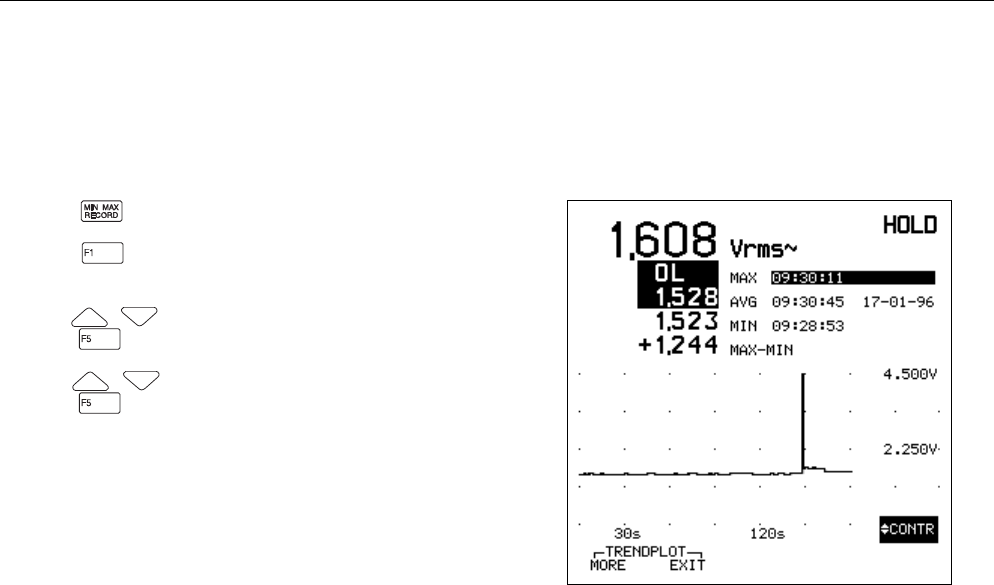
Looking at the Graphical Plot (TrendPlot™)
The test tool continuously logs the maximum, average, and
minimum readings, and displays all values as a graph, as
shown in Figure 4-3. Vertical scaling and horizontal time
compression are automatically resized to fit the TrendPlot
on the display. The TrendPlot is slowly traced on the
display from left to right until the screen is written and the
time scale is resized. The initial time scale is 15s/DIV; after
a full screen the scale is compressed to 30s, 1 min, 2 min,
etc., to a maximum of 40 days over a whole display.
ATTENTION
An overload of MAX or MIN will stop the Min Max
record mode. The overloaded value (Min or Max) and
the AVG are then displayed in reverse video, and the
time stamp of the overloaded value is stopped. The
TrendPlot will continue.


