


Fast Fourier Transforms
TDS 620A, 640A & 644A User Manual
3Ć47
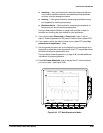
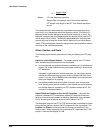
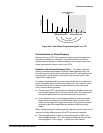
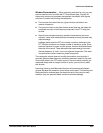
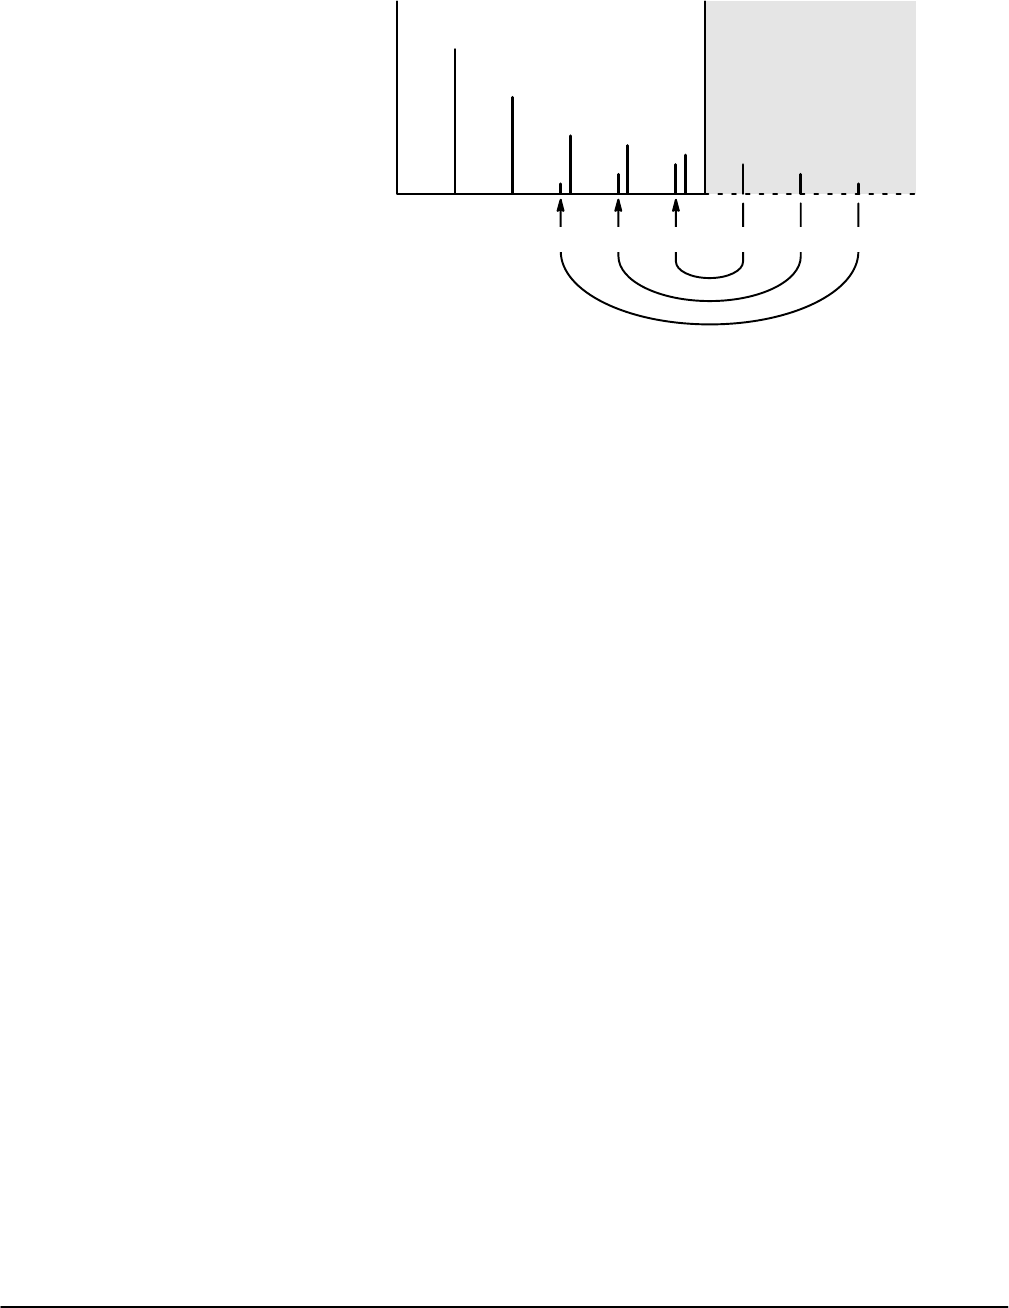
Nyquist Frequency
Point
Frequency
Amplitude
AliasedFrequencies Actual Frequencies
Figure 3Ć26:ăHow Aliased Frequencies Appear in an FFT
Considerations for Phase Displays
When you set up an FFT math waveform to display the phase angle of the
frequencies contained in a waveform, you should take into account the
reference point the phase is measured against. You may also need to use
phase suppression to reduce noise in your FFTs.
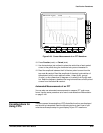
Establish a Zero Phase Reference Point Ċ The phase of each freĆ
quency is measured with respect to the zero phase reference point. The
zero reference point is the point at the center of the FFT math waveform but
corresponds to various points on the source (time domain) record. (See
Figure 3Ć24 on page 3Ć43.)
To measure the phase relative to most source waveforms, you need only to
center the positive peak around the zero phase point. (For instance, center
the positive half cycle for a sine or square wave around the zero phase
point.) Use the following method:
H First be sure the FFT math waveform is selected in the More menu, then
set horizontal position to 50% in the Horizontal menu. This positions the
zero phase reference point to the horizontal center of the screen.
H In the Horizontal menu, vary the trigger position to center the positive
peak of the source waveform at the horizontal center of screen. AlterĆ
nately, you can adjust the trigger level (knob) to bring the positive peak
to center screen if the phase reference waveform has slow enough
edges.
When impulse testing and measuring phase, align the impulse input into the
system to the zero reference point of the FFT time domain waveform:
H Set the trigger position to 50% and horizontal position to 50% for all
record lengths less than 15 K. (Your model oscilloscope may not have
record lengths of 15 K or longer Ċ consult your User manual.)