


Satellite Information
JS56696,0000A07 1902JUN113/3
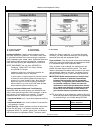
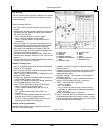
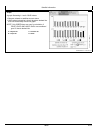
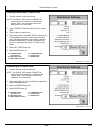
Graph
A graph illustrating L1 and L2 SNR values.
•
Bars are colored to satellites current status.
•
SNR values (colored bar) should be above dashed line
that runs horizontally across bar graph.
NOTE: Only GREEN bars are used in calculation of
PDOP, VDOP, AND HDOP. SNR’s are considered
good if above dashed line.
A—SkyPlot tab
B—Graph tab
C—Predictor tab
D—PDOP
PC13704—UN—12MAY11
203
061611
PN=24