


Satellite Information
Continuedon next page JS56696,0000A071902JUN112/3
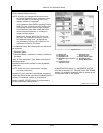
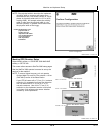
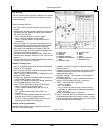
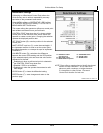
Sky Plot tab
The Sky Plot tab shows where the satellites are in relation
to the vehicles receiver, allowing the operator to look at
satellite geometry.
Reading Satellite Sky Plot
•
Sky Plot is fixed so North is always at the top of the
screen.
•
Satellites are displayed as their satellite ID number that
corresponds to the Satellite Tracking Chart located to
the right of the Sky Plot.
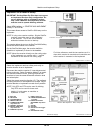
Red—indicates satellite is in search mode
Blue—indicates satellite is being tracked
Green—indicates satellite is OK (being used for
corrections)
•
Sky Plot consists of 3 concentric rings depicting 0, 30,
and 60 degrees of elevation with directional crossbar
intersection representing 90 degrees of elevation.
•
Gray radial lines extending from center of Sky Plot
represent azimuth. They are spaced 30 degrees apart
and represent 30 and 60 degrees.
•
Directional crossbar representing North, South, East,
and West also represent azimuth at 0, 90, 180, and 270
degrees.
•
W1 and W2 (WAAS or EGNOS) satellites and inmarsat
satellites are not shown in Sky Plot.
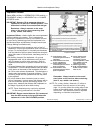
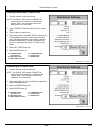
Satellite Tracking Chart
•
SAT ID—(Satellite Identification Number) Identification
number for GPS Satellite.
•
ELV—(Position Elevation) Elevation in degrees above
horizon for GPS satellite position.
•
AZM—(Position Azimuth) Azimuth in degrees from true
North for GPS satellite.
•
L1 SNR—(L1 Signal to Noise Ratio) Signal strength for
L1 GPS signal (signal to noise ratio).
•
L2 SNR—(L2 Signal to Noise Ratio) Signal strength for
L2 GPS signal (signal to noise ratio).
•
Status—(GPS Signal Status) Status of GPS signal.
Search—searching for satellite signal.
Track—tracking satellite signal and using it for
positioning.
OK—tracking satellite signal and using it for
positioning.
OK SF1—Tracking satellite signal and using it for
positioning with StarFire single frequency.
OK SF2—Tracking satellite signal and using it for
positioning with StarFire dual frequency.
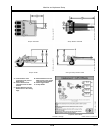
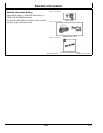
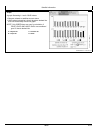
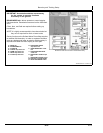
Satellite Tracking Information
Satellite Tracking information is displayed at bottom of
SKY PLOT and GRAPH tabs.
PC13703—UN—12MAY11
A—Sky Plot tab
B—Graph tab
C—Predictor
D—Satellites in Solution
E—Satellites Above Elevation
Mask
F—Satellites Tracked
G—Corrections Age
H—VDOP
I— HDOP
J—PDOP
K—Satellites on Sky Plot
L—Satellite Tracking
•
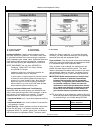
Satellites in Solution—number of satellites used to
compute position.
•
Satellites Above Elevation Mask—total number of GPS
satellites available to receiver that are above seven
degree elevation mask.
•
Satellites Tracked – total number of GPS satellites
tracked by receiver.
•
Corrections Age (sec.)—age of differential correction
signal to GPS (normally less than 10 seconds).
•
VDOP—Vertical Dilution of Precision.
below 2.0 optimal
2.0—2.5 desirable
2.5 or greater can indicate poor vertical accuracy
performance. AMS does not recommend operating
above this value.
•
HDOP—Horizontal Dilution of Precision.
•
PDOP—Positional Dilution of Precision is an indicator of
GPS satellite geometry as viewed by receiver. A lower
PDOP indicates better satellite geometry for calculating
both horizontal and vertical position.
202
061611
PN=23