


4-39
MegaZoom Concepts and Oscilloscope Operation
Using Digital Channels to Probe Circuits
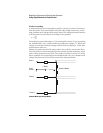
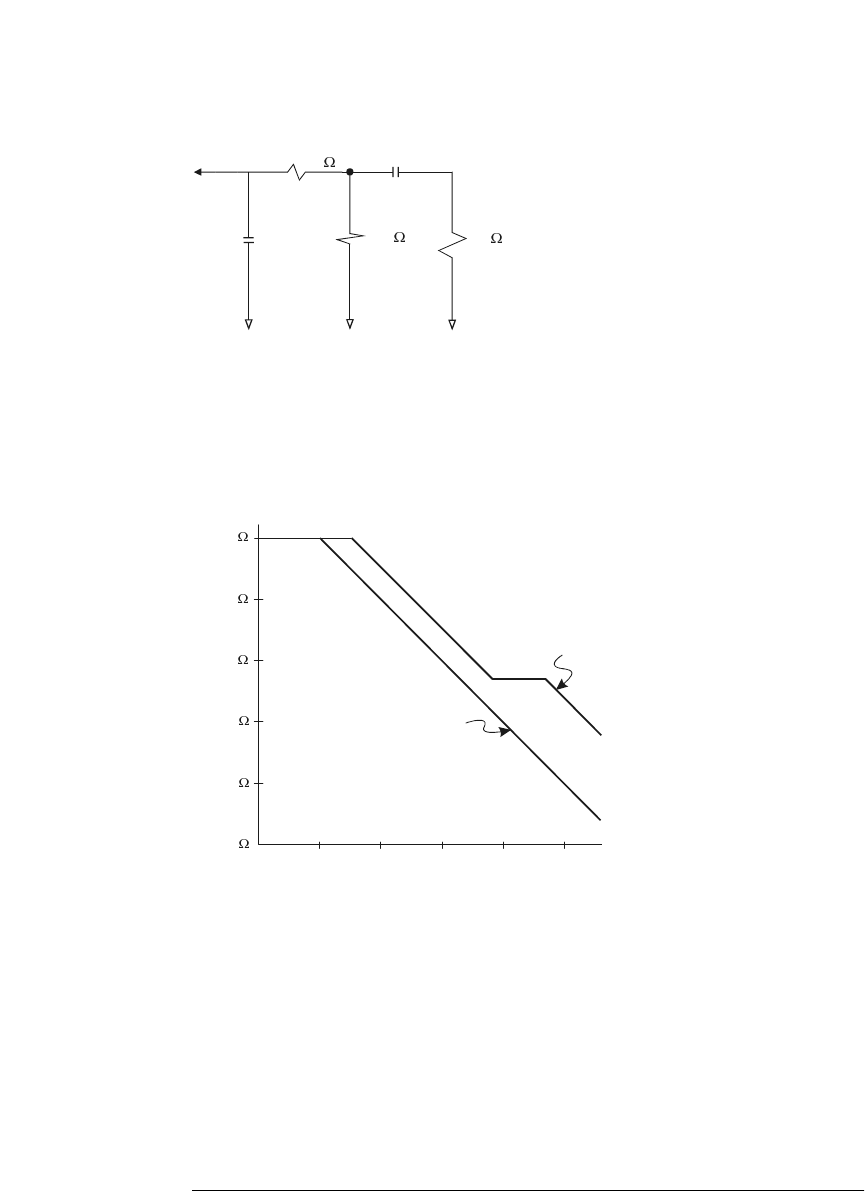
High-Frequency Probe Equivalent Circuit
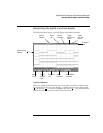
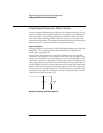
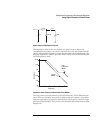
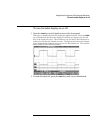
The impedance plots for the two models are shown in these figures. By
comparing the two plots, you can see that both the series tip resistor and the
cable’s characteristic impedance extend the input impedance significantly. The
stray tip capacitance, which is generally small (1 pF), sets the final break point
on the impedance chart.
Impedance versus Frequency for Both Probe Circuit Models
The logic probes are represented by the high-frequency circuit model shown
above. They are designed to provide as much series tip resistance as possible.
Stray tip capacitance to ground is minimized by the proper mechanical design
of the probe tip assembly. This provides the maximum input impedance at high
frequencies.
1 pF
7.5 pF
150
2
5
0
100 k
100 k
10 k
1 k
100
10
1
10 kHz 100 kHz 1 MHz 10 MHz 100 MHz 1 GHz
High
Frequency
Model
Typical
Model
Frequency
Impedance