167
16
Monitoring System Status and Performing
Diagnostics
This chapter shows you where to find information related to system
events (alarms) and DSL line performance, and how to run a
diagnostic program to troubleshoot problems.
<#%
You can use the Configuration Manager to view information about
alarms that occur in the system. Alarms, also called traps, are
caused by a variety of system events, including connection
attempts, resets, and configuration changes. This information may
be helpful in working with your ISP to troubleshoot problems you
encounter with the device. (Despite their name, not all alarms
indicate problems in the functioning of the system.)
<#%'
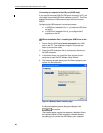
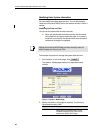
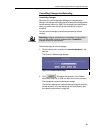
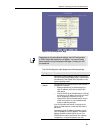
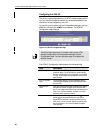
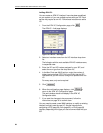
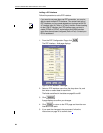
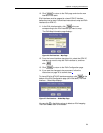
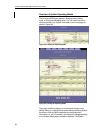
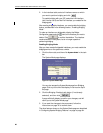
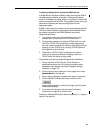
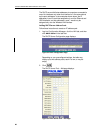
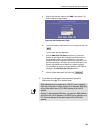
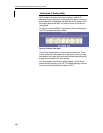
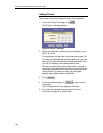
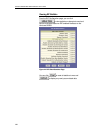
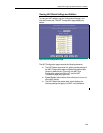
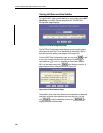
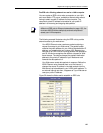
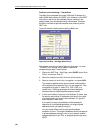
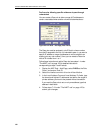
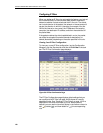
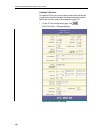
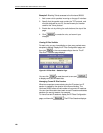
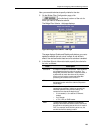
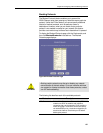
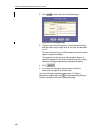
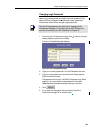
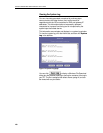
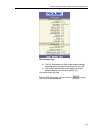
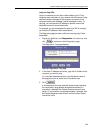
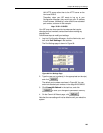
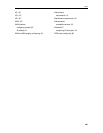
To display the Alarm page, log into the Configuration Manager, click
the Admin tab, and then click in the task bar. The Alarm
page is shown in Figure 73.
Figure 73. Alarm Page
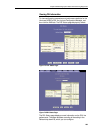
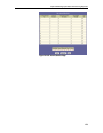
Each row in the table displays the time and date that an alarm
occurred, the type of alarm, and a brief statement indicating its
cause.
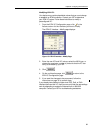
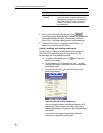
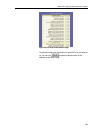
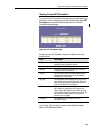
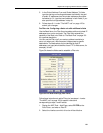
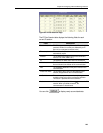
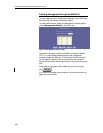
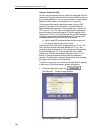
You can click on the Refresh Rate drop-down list to select a
recurring time interval after which the page will redisplay with new
data.
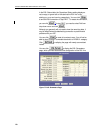
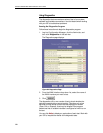
You can click to display a Windows File
Download dialog box that enables opening or saving the contents of
the log to your PC. The file is assigned the default name alarm.vlf,
and can be viewed with any text editor.
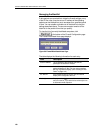
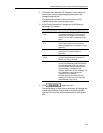
To remove all entries from the list, click . New entries will
begin accumulating and will display when you click .