


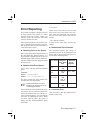
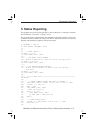
3. Frequency Profiling
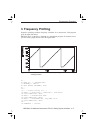
Frequency profiling visualizes frequency variations for a certain time. This program
gives an output file called:
PROFILE.DAT. If this file is imported to a spreadsheet program, for instance Excel,
you can create a graph like the one in the figure below.
50 ‘
60 OPEN “O”, 1, “PROFILE.DAT”
70 CNTNAME$ = “DEV10"
80 CALL IBFIND (CNTNAME$, CNT%)
90 ‘
100 ‘
110 ‘ —— Enable arming, etc. ——
120 WRT$ = “:TRIG:COUN 1; :ARM:COUN 1; SOUR EXT4"
130 CALL IBWRT(CNT%, WRT$)
140 WRT$ = “:INP:LEV:AUTO ONCE
150 CALL IBWRT(CNT%, WRT$)
160 WRT$ = “:DISP:ENAB OFF; :ACQ:APER 1E-6"
170 CALL IBWRT(CNT%, WRT$)
180 ‘
190 ARMDELAY = .0000002
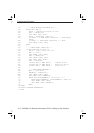
Programming Examples
GW-Basic for National Instruments PC-IIA, Setting Up the Interface 4-5
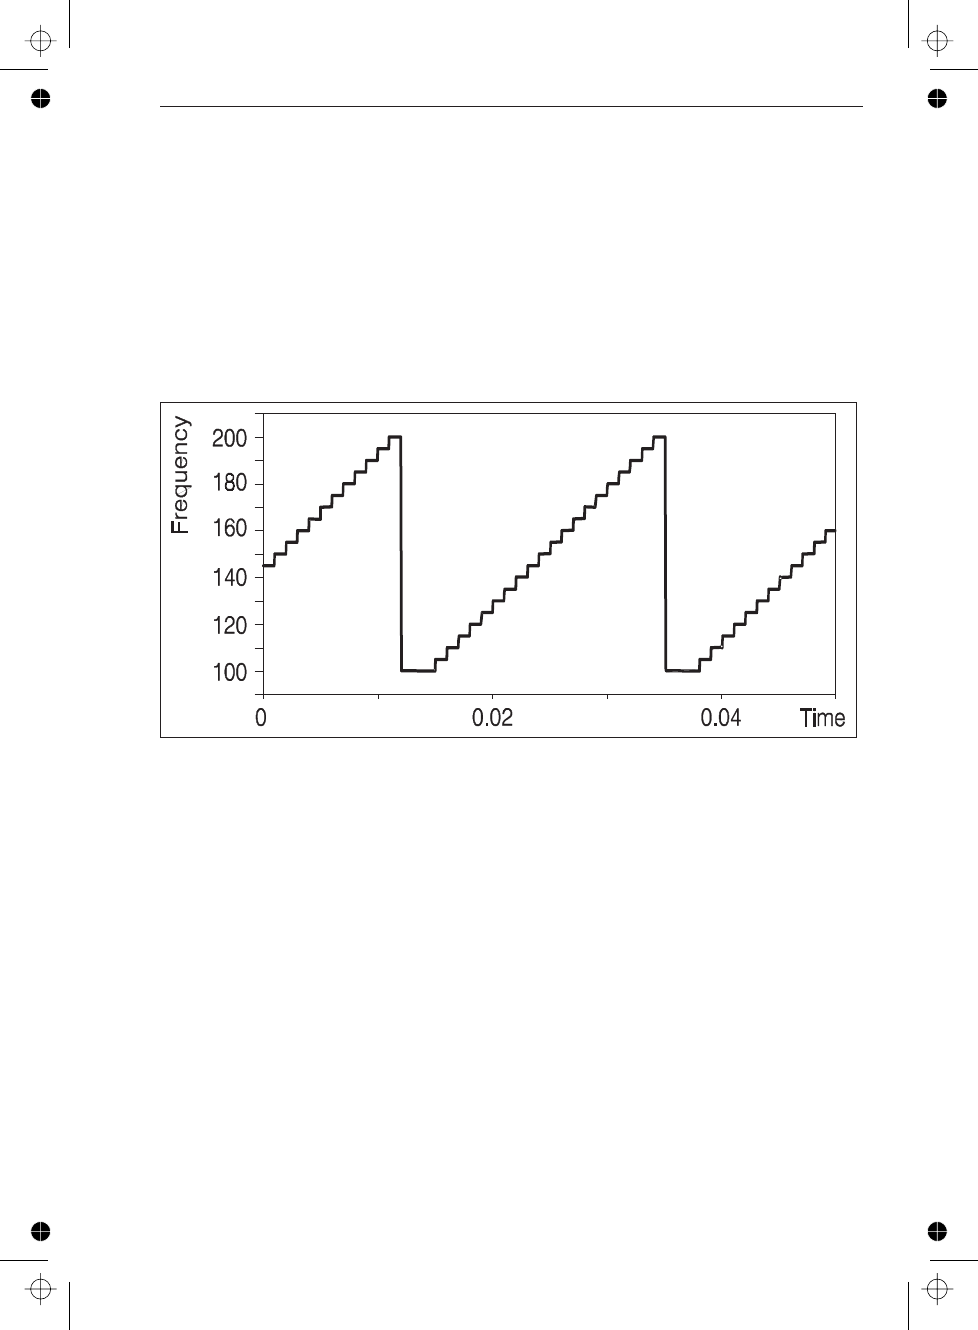
Figure 4-1 This figure is the results of frequency profiling on a
sweep generator.