


Fluke 123/124
Users Manual
22
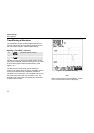
TrendPlotting a Waveform
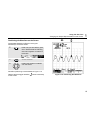
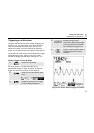
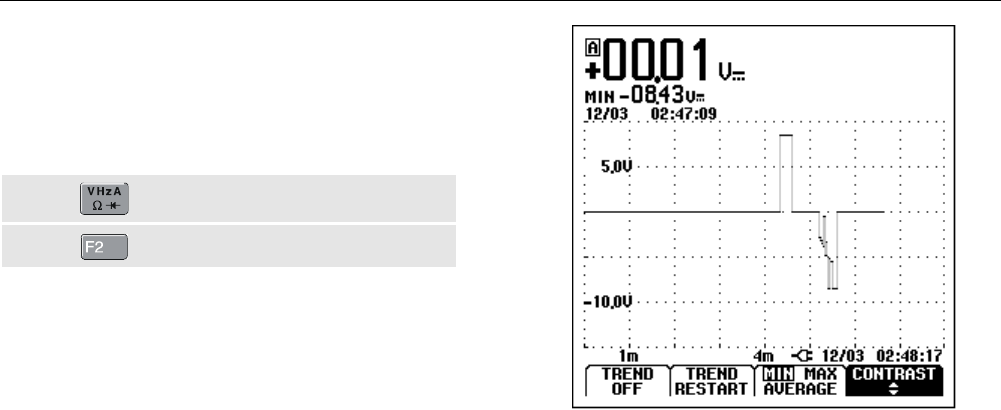
The TrendPlot™ function plots the digital readings as a
function of time. Date and time stamp shows the time of
the most recent change in a MIN or MAX reading.
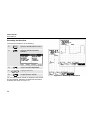
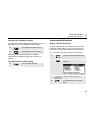
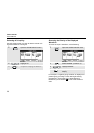
Starting a TrendPlot™ function
Open the INPUT A menu.
Start TRENDPLOT.
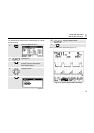
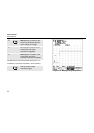
The test tool records the minimum (MIN) reading as the
main (upper displayed) measurement of input A. The date
and time stamp appear below the MIN reading. (See
Figure 1-13.)
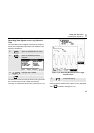
The test tool also continuously logs all readings to
memory and displays these as graphs. Automatic vertical
scaling and horizontal time compression resizes the
TrendPlot to fit on the screen. The TrendPlot is built up on
the screen from left to right until the screen is full. The
automatic time scaling then compresses this information
to about half the screen.
Figure 1-13. TrendPlot Reading
Note
When a new minimum value is detected , a beep
occurs and the new minimum is displayed.