


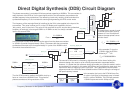

Frequency Generator for the Spartan-3E Starter Kit 10
Phase Accumulator Spectrum
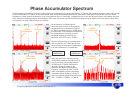
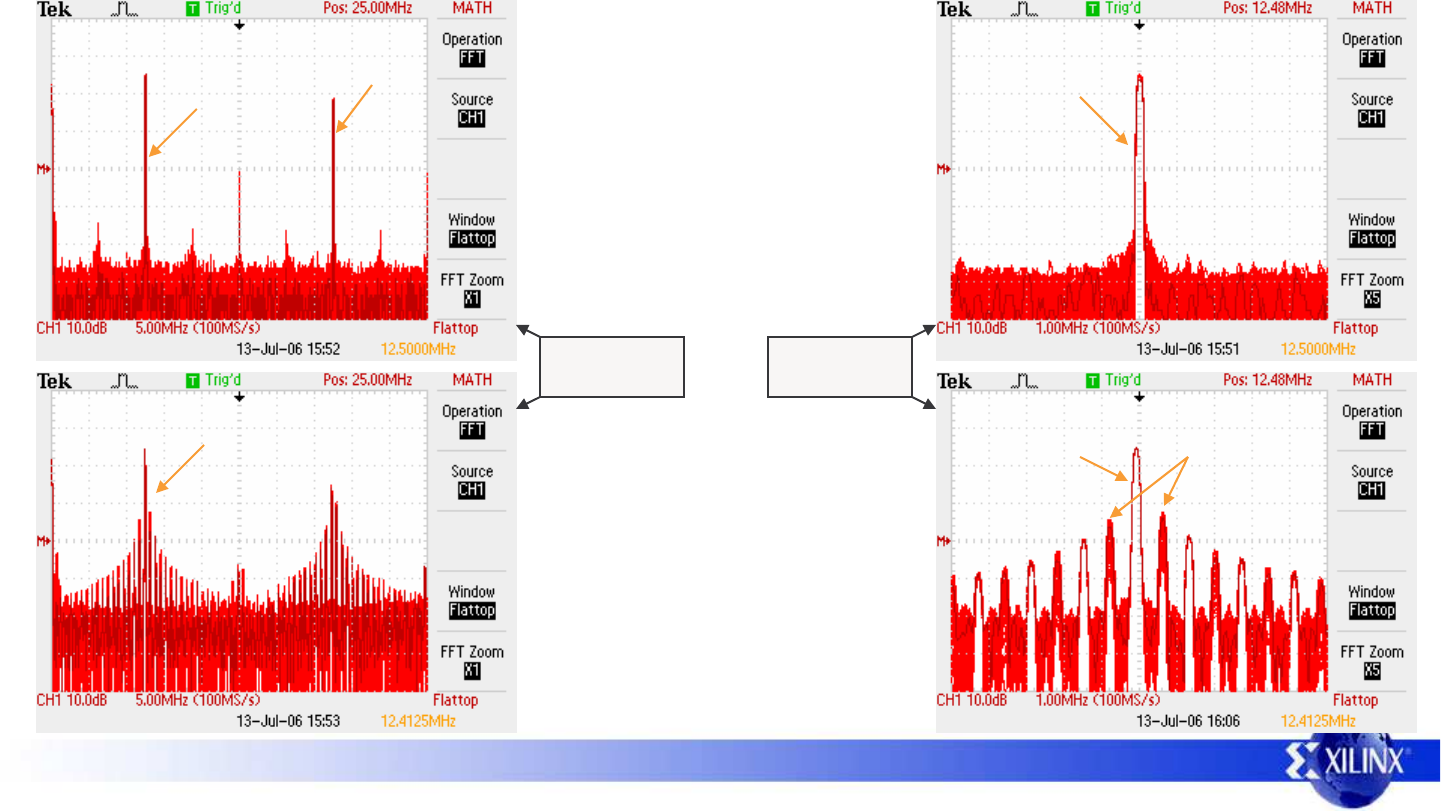
An alternative way to observe the quality of the waveforms synthesised by the phase accumulator is to look at the frequency spectrum. I was lucky enough
to have a 2048-point FFT feature on my oscilloscope which allows some simple observations to be made. Once again I have set the display to infinite
persistence in order capture the spectrum over a long period of time (>15 seconds). I suggest that you do not look for exact values, but compare the plots
which have been captured using the same scales in each case. On the left are plots that show the spectrum up to 50MHz and on the right the plots show
are zoomed in to show ±5MHz centred on 12.5MHz.
As we know the 12.5MHz signal is
nominally clean in terms of the synthesis
process and this is reflected by a distinct
12.5MHz component which is >45dB above
the noise floor. The zoomed plot shows how
the fundamental covers only a narrow
bandwidth keeping in mind that the
resolution of the FFT is only ~50KHz.
Note the third harmonic of a square wave is
also very distinct at 37.5MHz and is even
close to being the theoretical 9.54dB down
from the fundamental (1/3 amplitude).
12.5MHz
Fundamental
5MHz/division
10dB/division
1MHz/division
10dB/division
3
rd
Harmonic
12.5MHz
Fundamental
12.4125MHz
Fundamental
12.4125MHz
Fundamental
When we move to the less than perfect
12.4125MHz waveform the effects of that
5ns of cycle jitter and jumping between
12.5MHz and 11.76MHz waveforms is
obviously having an impact on the
spectrum. Although the fundamental
frequency component is good, if a little
wider in bandwidth, there are significant
modulation effects leading to a family of
spectral components and raised noise floor.
Hint – 12.5MHz-11.76MHz = 0.74MHz
12.4125±0.74MHz