


12
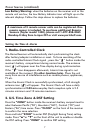
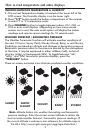
The color graphs are designed as an intuitive way to gauge the
weather at a glance. The left color bar graph represents the respective
Indoor/Outdoor temperature, heat index or dew point of the current
display mode. The right graph represents the respective
Indoor/Outdoor humidity. As the measurements change, the number
of illuminated bars changes automatically. The higher the temperature
and humidity, the taller the bars. Lower temperatures and humidity
show shorter bars.
Color Bar Graphs
NOAA Weather Radio
NOAA Weather Radio All Hazards (NWR) is a nationwide network of
radio stations broadcasting continuous weather information directly
from a nearby National Weather Service office. It is the lone
government-operated radio system that provides direct warnings to the
public for natural and man- made hazards, from floods to forest fires
to oil spills. NWR broadcasts National Weather Service warnings,
watches, forecasts and other hazard information 24 hours a day. These
broadcasts air on one of 7 channels.
To check the NOAA channel (Frequency) available for your area, visit
the web site below and select your state & county/city/area. Then use
the “NOAA CHANNEL” button on the front of the receiver unit to
select the NOAA channel number corresponding to the frequency of
your area.
http://www.nws.noaa.gov/nwr/indexnw.htm
Frequency Coverage of NOAA weather radio
Channel 1 : 162.400 MHz
Channel 2 : 162.425 MHz
Channel 3 : 162.450 MHz
Channel 4 : 162.475 MHz
Channel 5 : 162.500 MHz
Channel 6 : 162.525 MHz
Channel 7 : 162.550 MHz
NOAA On mode:
Press the “NOAA ON/OFF” once to turn on NOAA radio and listen to
the weather broadcast. “NOAA” and its channel icon (1-7) will appear
at the upper right of the LCD. Press “NOAA CHANNEL” button on the
front of the receiver to toggle to one of the seven channels
Use the “VOL” dial on the side of the receiver to adjust the volume
level.