


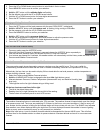

Model: WS-1517 www.lacrossetechnology.com/support 10
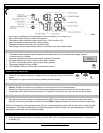
3. Press the UP or DOWN button arrow buttons to set altitude in feet or meters
4. Press MEMORY button once to confirm your selection
5. Hold the SET button until the altitude digits are flashing.
6. Set the altitude value with the UP or DOWN arrow buttons. 33
7. Hold the UP or DOWN arrow button for faster digits advancement.
8. Press the SET button to confirm your selection.
Changing or Setting Sea Level Pressure
1. Press the SET button until the local pressure with the word “SEA LEVEL” is displayed.
2. Hold the MEMORY button until the pressure unit is flashing, InHg, mmHg or hPa/mBar InHg
3. Set the pressure units with the UP or DOWN arrow buttons
4. Press the MEMORY button to confirm your selection
5. Hold the SET button until the pressure digits flash. 29.91
6. Set the sea level pressure using the UP or DOWN buttons to adjust the pressure value.
7. Hold the UP or DOWN arrow buttons for faster digits advancement
8. Press the SET button to confirm your selection.
View the Sea Level Pressure History
1. From any mode, press the HISTORY button.
2. When the Sea Level Pressure is displayed, press and release the HISTORY button repeatedly to
view the sea level pressure history for the past 24 hours, in one hour intervals.
3. If no buttons are pressed for 5 seconds, the weather station will automatically exit the history mode and return to the
Pressure and Weather Forecast mode.
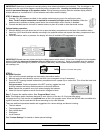
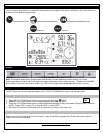
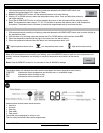
View the Pressure, Temperature and Humidity Bar Charts
The pressure bar graph shows barometric pressure variations over the past 24 hours. This is very useful for
understanding the Barometric trends that are used in weather forecasting. Each bar icon represents 0.06 InHg.
Alternatively, the bar chart can be used to display 24 hour trend data for sea level pressure, outdoor temperature or
outdoor humidity (channel 1 only).
1. Select the Pressure and Weather Forecast window.
2. Hold the ALARM/CHART button to change the bar chart title (right bottom corner).
3. Alternate between Pressure, Outdoor Temperature (thermometer icon) and Relative Humidity (dew
drop icon).
4. The single bar on the far right indicates rising or falling trend.
All the bar charts are read from left to right.
The left is the oldest history data.
Reading from left to right indicates the rise and fall of the reading.
The bar chart will constantly scroll to avoid LCD burnout.
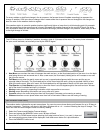
Weather Forecast Icons
The weather forecasting feature is estimated to be 70% accurate. The weather forecast is based solely upon the change
of air pressure over time. The icons are predicting 12-24 hours in the future, not current conditions. It may be sunny out
your window, but the pressure is falling so the forecast station will show clouds with rain icon. The SUNNY icon indicates
clear weather, even when displayed during the night-time.The icons displayed forecast the weather in terms of getting
better or worse, and not necessarily sunny or rainy as each icon indicates.
Note: After initial set-up, icons for weather forecasts should be disregarded for the next 48-60 hours. This will allow
sufficient time for the weather station to collect air pressure data at a constant altitude and result in a more accurate
forecast.