


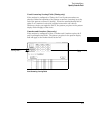
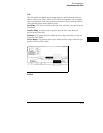


Statistics Markers
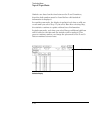
After you have assigned patterns to the X and O markers, statistical
information is available when you set markers to Statistics. The logic
analyzer displays the following information:
• Number of valid runs (runs where Pattern markers were able to be
placed on specified patterns).
• Minimum time between the X and O Pattern markers.
• Maximum time between the X and O Pattern markers.
• Average time between the X and O Pattern markers.
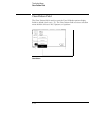
In a state analyzer, Statistics markers become available only when the
Count field in the Trigger menu is set to Time.
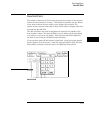
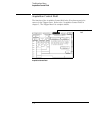
The markers are color-coded for easy recognition in the data listing.
The X marker is represented by a horizontal green line and the O
marker is represented by a horizontal yellow line.
6–17