


33
If the Weather station is moved to another location significantly higher or
lower than its initial standing point (for example from the ground floor to
the upper floors of a house), discard the weather forecast for the next 48-
60 hours. By doing this, the Weather Station will not mistake the new
location as being a possible change in air-pressure when really it is due
to the slight change of altitude.
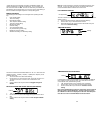
WEATHER TENDENCY INDICATOR
Working together with the weather icons are the weather tendency
indicators (located on the left and right sides of the weather icons). When
the indicator points upwards, it means that the air-pressure is increasing
and the weather is expected to improve. When the indicator points
downwards, the air-pressure is dropping and the weather is expected to
become worse.
Taking this into account, one can see how the weather has changed and
is expected to change. For example, if the indicator is pointing
downwards together with cloud and sun icons, then the last noticeable
change in the weather was when it was sunny (the sun icon only).
Therefore, the next change in the weather will be cloud with rain icons
since the indicator is pointing downwards.
34
Note: Once the weather tendency indicator has registered a change in air
pressure, it will remain permanently displayed on the LCD.
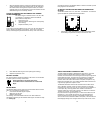
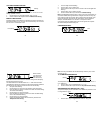
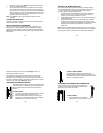
AIR PRESSURE HISTORY (ELECTRONIC BAROMETER WITH
BAROMETRIC PRESSURE TREND)
The third section of the LCD also shows the relative air pressure value
and the air pressure history.
The bar chart indicates the air pressure history trend over the last 24
hours in 7 steps, 0h, -3h, -6h, -9h, -12h, -18h, and -24h. The “0h”
represents the current full hour air pressure recording. The columns
represent the “hPa” (0, ±2, ±4, ±6) at specific time. The “0” in the middle
of this scale is equal to the current pressure and each change (±2, ±4, ±6)
represents how high or low in “hPa“ the past pressure was compared to
the current pressure.
A
ir pressure over the last 24 hours
35
If the bars are rising it means that the weather is getting better due to the
increase of air pressure. If the bars go down, it means the air pressure
has dropped and the weather is expected to get worse from the present
time “0h“.
Note:
For accurate barometric pressure trends, the Weather Station should
operate at the same altitude. For example, it should not be moved from
the ground to the second floor of the house. Should the unit be moved to
a new location, discard readings for the next 48-60 hours.
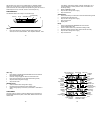
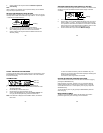
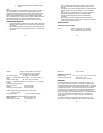
OUTDOOR TEMPERATURE AND HUMIDITY DATA
The fourth LCD section shows the outdoor temperature and humidity, the
reception indicator, the transmitter identification number and the
MIN/MAX outdoor data.
TOGGLING AND RESETTING THE OUTDOOR DATA
Outdoo
r
temperature
in °C/ °F
Outdoor
relative
humidity
in RH%
Outdoor transmitter
identification number
MIN icon
36
1. To toggle between the current outdoor and the MAX/MIN outdoor
temperature and humidity data and the times (for temperature data
only) they were recorded press the OUT/+ key:
- Once to show the MAX outdoor temperature and humidity data
with the recorded time and date.
- Twice to show the MIN outdoor temperature and humidity data
with the recorded time and date.
- Three times to return to the current displayed values.
2. Once the MIN or MAX data is displayed, press and hold the SET
key for 3 seconds to reset the respective MIN or MAX record to
current temperature and humidity data, and current time, date
display.
Note: The MIN or MAX data needs to be reset individually.
TO VIEW THE MIN/MAX DATA FROM DIFFERENT
TRANSMITTERS
When more than 1 transmitter used:
1. To toggle between transmitters, press the SNOOZE/CH key:
Once to show transmitter 2
Twice to show transmitter 3
Three times to return to transmitter 1