


16
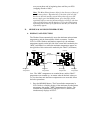
air pressure has a rising trend, and the weather should improve. If the
bars are dropping (lower on the right than the left) then the air pressure
has a falling trend, and the weather should worsen.
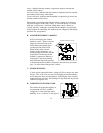
B. RAINFALL HISTORY
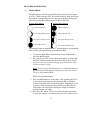
The bar graph will also display the rainfall history; this mode is
indicated by the appearance of the word “RAIN” at the top of the
LCD 5 screen.
The horizontal axis measures the past time periods, with “0”
representing the current day, week, or month and “7” representing the
oldest information (7 days ago, 7 weeks ago, or 7 months ago). The
graph reads from right to left.
The vertical axis measures the rainfall in either preferred increments of
inches or millimeters. The normal (default) measurement scale is: in
inches {0, 0.1, 0.3, 0.5, 1, 2, 3, 5, 10}; in millimeters {0, 1, 3, 5, 10, 30,
50, 100}. If, within any selected time period (1 day, 1 week, 1 month),
rainfall exceeds 7 inches (178mm) the measurement scale
automatically changes to: in inches {0, 1, 3, 5, 10, 20, 30, 50, 100}; in
millimeters {0, 10, 30, 50, 100, 300, 500, 1000}.
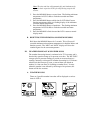
The bar graph will display the rainfall history either by day, week, or
month. To select which display:
1. Press the RAIN button twice. The “DAY” icon will flash beside
the “RAIN” icon at the top of LCD 5.
2. Press the CH/+ button to toggle through the “WEEK,” “MONTH,”
and “DAY” icons.
3. Press the RAIN button (or wait 20 seconds) to confirm and exit this
selection mode.
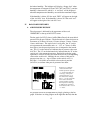
If “DAY” is selected, the graph will display the rainfall history for
the past 7 days. The information that is displayed in column “0”
(the right column) is renewed daily at midnight, and the
information contained in the columns is shifted to the left. If
“WEEK” is selected, the graph will display the rainfall history for
the past 7 weeks. The information that is displayed in column “0”
is renewed every Monday at midnight, and the information
contained in the columns is shifted to the left. If “MONTH” is
selected, the graph will display the rainfall history for the past 7
months. The information displayed in column “0” is renewed on
the first day of every month, at minight. The information
contained in the columns is shifted to the left.