


15
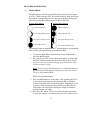
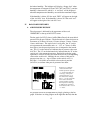
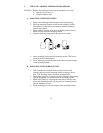
the indoor humidity. The indicator will display a “happy-face” when
the temperature is between 68°F and 79°F (20°C and 25.9°C), and the
humidity is between 45% and 64%. A “sad-face” will be displayed
when the temperature and humidity are outside the mentioned ranges.
If the humidity is below 45% the word “DRY” will appear to the right
of the “sad-face” icon. If the humidity is above 54% the word “wet”
will appear to the right of the “sad-face” icon.
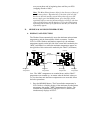
IV. BAR GRAPH HISTORIES
A. AIR PRESSURE HISTORY
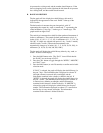
The air pressure is indicated by the appearance of the word
“PRESSURE” at the top of the LCD 5 screen.
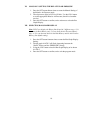
The bar graph (in LCD 5) shows in hPa (Hekto Pascal) the recorded air
pressure over the past 24-hours. The horizontal axis shows the hours at
increments of 24-hours, 18-hours, 12-hours, 6-hours, 3-hours, 2-hours,
1-hour, and 0-hours. The vertical axis is set by hPa: the “0” on this
axis represents the current hPa, and + or – 1,3,5, or 7 shows (in hPa)
how high or low the past air pressure was as compared to the current
one. The “0” on the vertical axis indicates the air pressure value seen
in LCD 4. The “0” on the horizontal axis indicates that the “0” on the
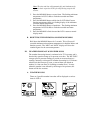
vertical axis is the present air pressure. Each brick on the bar graph
represents a value of 0.03 hPa, and each brick also has a corresponding
value on the verticle axis. Multiply the two values to find past air
pressure (note the + or – sign of values on the verticle axis); i.e.
0.03 hPa x 3 = 0.09 hPa, now add this value to the air pressure
(in LCD 4) to evaluate what past air pressures have been.
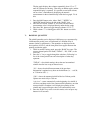
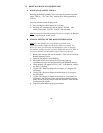
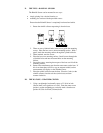
Air pressure trends can be determined by simply glancing at the bar
graph. If the bars are rising (higher on the right than the left) then the
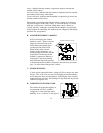
P
Position “0” on both the
vertical and horizontal
indicate present air pressure.
“-1” on the horizontal was
1-hour ago. The top bar
corresponds with “-1” on
the vertical axis, multiply
0.03 x –1, we get –0.03 hPa.
Add –0.03 to current air
pressure readings to attain
the air pressure 1-hour ago.
A decline in air pressure is
shown between the “-3” and
“-1” hours.