


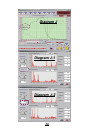
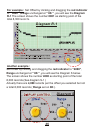
Indicates different data files loaded and shown in different colors of
histogram.
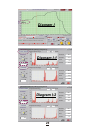
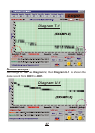
To compare with different data files :
Diagram M displays main screen before retrieving any file.
Diagram N is what you see after loading the example files:
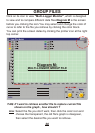
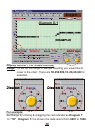
You can always change the offset and range setting desired by
moving the indicator on the yellow button. Please see Diagram O ,
refer to the introduction DISPLAY CONTROL , read throughly for
more detail description & examples .
32
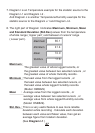
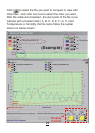
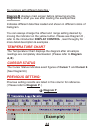
The Temperature Chart displays the diagram after all sample
readings are completely downloaded. (Please refer to Diagram
A, B)
TEMPERATURE CHART
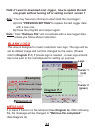
CURSOR STATUS
The Cursor Status indicates exact figures of Cursor 1 and Cursor 2.
(See DiagramQ)
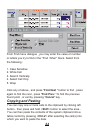
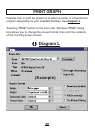
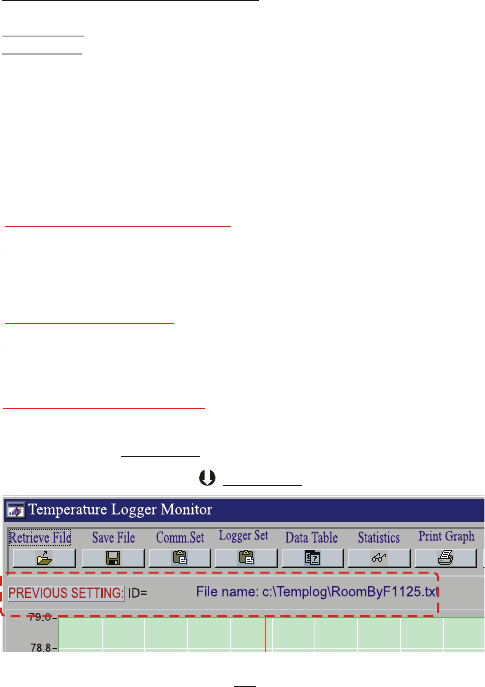
PREVIOUS SETTING:
Previous setting records are listed in this column for reference.
( Please refer to Diagram P. )
Diagram P
(Example)