


18
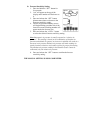
5. The “0h” on the horizontal axis indicates the current hour, thus the
current air pressure also.
6. Each bar on the bar graph represents a value of 0.03 hPa, and each
bar also has a corresponding value on the verticle axis.
7. Air pressure trends can be determined by simply glancing at the
bar graph.
a. If the bars are rising (higher on the right than the left) then the
air pressure has a rising trend, and the weather should
improve.
b. If the bars are dropping (lower on the right than the left) then
the air pressure has a falling trend, and the weather should
worsen.
8. Multiply the two values to find past air pressure (note the + or –
sign of values on the verticle axis); i.e. 0.03 hPa x 3 = 0.09 hPa,
now add this value to the air pressure (in LCD 4) to evaluate what
past air pressures have been.
9. The bar chart will constantly scroll to avoid burnout of the LCD.
Note:
This feature cannot be turned off.