


23
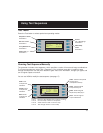
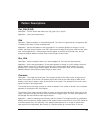
Ramp
Description - This image provides an active video area starting from full black (+7.5 IRE for NTSC) at
one edge of the screen to full white (+100 IRE) at or near the opposite end of the screen.
Application - Useful for testing pixel anomolies and chrominance.
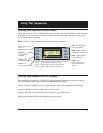
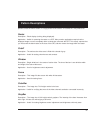
PulseBar
Description - The image looks like two vertical lines followed by a wide vertical bar on a display’s
screen. The first line is a red pulse. The pulse is 20 T for PAL and 12.5 T for NTSC formats. The
second narrower line is a 2 T white sine-squared pulse. T = 100 nSec for PAL and 125 nSec for
NTSC formats. The wide bar is white with sine-squared edges.
Application - This image is intended for TV formats, but can be displayed with any format up to 100
MHz.
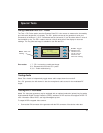
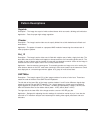
Burst
Description - The left side starts with reference white and black levels. This is followed by six bursts
of square waves. Each burst is at a different frequency, forming vertical lines of various widths. The
frequencies, going from left to right, are 0.5, 1, 1.53, 2.04, 3.06 and 6.13MHz.
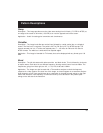
Application - The image can also be used with a TV waveform analyzer to check the frequency
response of a video system. One scan line of the image, as it would appear on a waveform analyzer.
High frequency roll-off (loss) would show up as a decrease in the peak-to-peak swings on the right
side of the waveform. Low frequency roll-off would show up as a decrease in the peak-to-peak
swings on the left side of the waveform.
Pattern Descriptions