


27
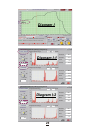
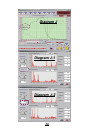
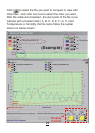
7. Diagram I is an Temperature example for the statistic source to the
Diagram I-1 and Diagram I-2 .
And Diagram J is another Temperature/Humidity example for the
statistic source to the Diagram J-1 and Diagram J-2.
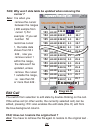
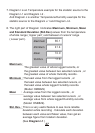
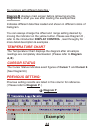
8. The right part of Diagram I indicates Maximum, Minimum, Mean
and Standard Deviation (Std.Dev) values from the temperature
of whole range ( Upper part ) and between 2 cursors' range
( Lower part ).
Maximum :
The greatest value of whole logged records, or
the greatest value between two selected cursors , or
the greatest value of whole Humidity records.
Minimum : The least value from the logged records , or
the least value between two selected cursors, or
the least value whole logged Humidity records.
(Model: OM8829)
Mean : Average value from the logged records , or
average value between two selected cursors , or
average value from whole logged Humidity records.
(Model: OM8829).
Std. Dev. : This is a very useful feature to see more reliable
deviation while recording . Calculate each deviation
between each value and Mean value, then get an
average figure from totalism deviation.
(See Diagram I-1 )
Maximum
Minmium
Mean
Std.Dev
85.1
41.4
72.0
11.6