


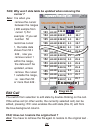

STATISTICS
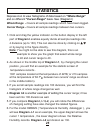
Depress icon to view histograms of data based on "Whole Range"
and on different "Cursor Range" basis. See (Diagram I)
1.
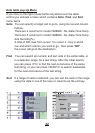
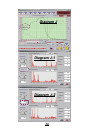
. Diagram I-2 is another example of setting the
Whole Range - Covers all sample readings which have been logged.
Cursor Range - Covers all sample readings between two cursors.
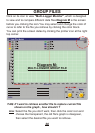
Click and drag the yellow indicator on the button display in the left
part of Diagram I enables equally divide all sample readings into
4 divisions (up to 130). This can also be done by clicking on /
or by keying in the figure directly.
cursor range; it has
been set into 100 division as well.
5. If you compare Diagram I, I-1,I-2, you will notice the differences
of changing setting have also changed the related figures.
6
Note: You might not be able to see this diagram, this is an
example to show you the graph that select whole range
to 40 and cursor range to 40 .
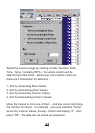
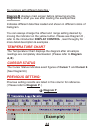
. For the model OM8829 ( Temperature & Humidity datalogger ) , you
will see Diagram J-1 as an example, the upper diagram shows the
cursor 1 temperature , the lower diagram shows the Relative
Humidity records. Diagram J-2 set division as 130.
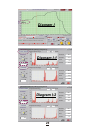
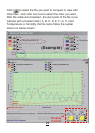
2. As shown in the middle top of Diagram I-1, by changing the cursor
position, you will find an example for the statistic screen of
temperature records .
o
1021 samples located at the temperature of 44 C( or 213 samples
o
at the temperature of 62.7 between two cursors' range as shown
C
in the middle bottom).
3. If you set all sample readings into 100 divisions, you will find the
histogram of whole range changed as well.
4
25