


22
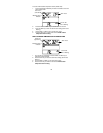
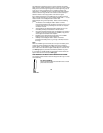
AIR PRESSURE
The fifth section of the LCD shows the relative air pressure and the air
pressure history.
The reference relative air pressure can be set between 28.35 to 30.72
inHg (960 to 1040hPa). See “Relative pressure value setting” in
manual setting.
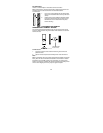
BAR GRAPH DISPLAY
You may select to display the history of the air pressure in the form of a
graph consisting of vertical bars on the intelligent weather station LCD.
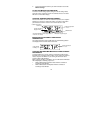
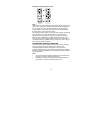
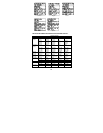
AIR PRESSURE HISTORY
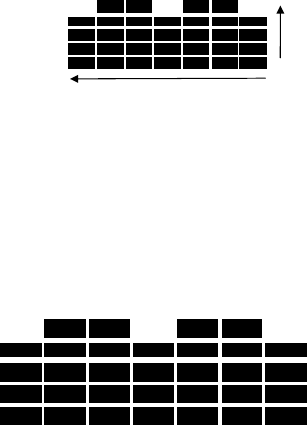
The bar graph of the electronic barometer shows the air pressure history
for the past 12 hours in 7 steps.
The horizontal axis represents the last 12 hours air pressure recordings
(-12, -6, -5, -4, -3, -2, -1, and 0 hour, from right to left). The bars are
plotted at each of the 7 steps and give the trend over the recorded
period. The scale on the right compares the result. The ″0″ in the middle
of this scale determines the current air pressure.
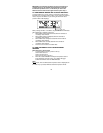
The vertical axis represents the air pressure changes in hPa (4.5, 3, 1.5,
“0” represents the current air pressure). Each change (±1.5, ±3, ±4.5;
the other values are not shown on the vertical axis but can be
determined) shows in inches of mercury (hPa), how high or low the past
air pressure was as compared to the current one. Rising bars indicate
the weather is getting better due to an increase in air pressure. A
downward sloping bars indicates a drop of the air pressure and the
weather is expected to get worse from the present time ″0″.
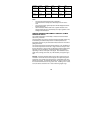
-12 h -9h -6h -3h -2h -1h 0h
4.5hPa
3hPa
1.5hPa
0hPa
-1.5hPa
-3hPa
-4.5hPa
A
ir pressure over the last 12 hours
A
ir pressure
changes in hPa