


65
USE USE
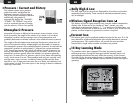
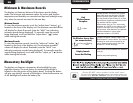
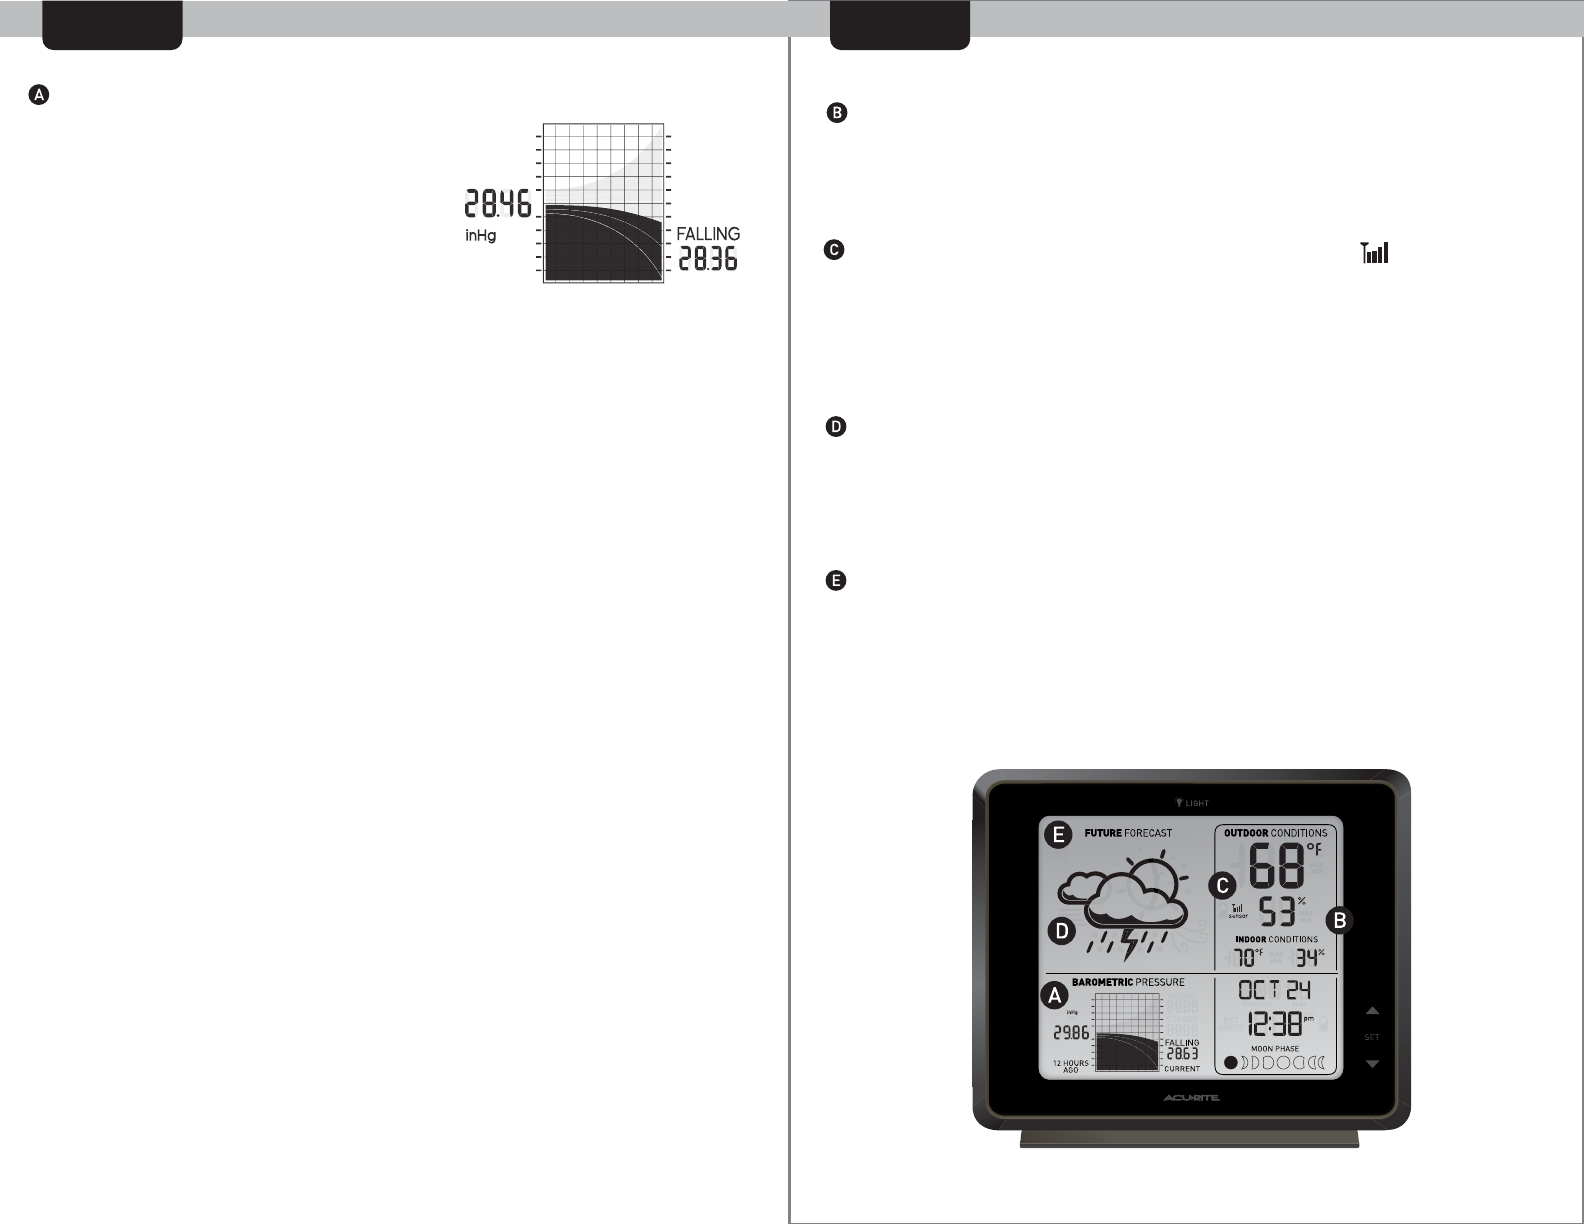
Pressure : Current and History
Daily High & Low
Wireless Signal Reception Icons
Forecast Icon
14 Day Learning Mode
Atmospheric Pressure
This weather station has a pressure
graph that tracks and displays the
barometric pressure 12 hours ago as
well as the current barometric pressure.
Additionally, the graph will
automatically display the “FALLING”,
“STEADY” OR “RISING” icon and a
curve to represent the rate of change
over the previous 12 hour time period.
The daily high and low records are displayed for the indoor and outdoor
temperature and humidity. These records ar cleared automatically every
day at midnight.
The display unit has a signal reception icon near the outdoor temperature
display area. If there are a low number of “bars” present, you may
experience no temperature display ( “- -” ) or inacurracy. In either case, you
may need to relocate one or both of the units. If most or all 4 of the bars are
present, wireless reception is good and no action is required.
This feature gives you the predicted weather forecast for the next 12 to 24
hours based on an advanced algorithm that includes barometric pressure
and temperature. This weather station will provide the most accurate
forecast that a single station weather instrument can provide.
This weather station has a patented “fourteen day learning mode”
calibration process. During this learning mode the weather station will
make altitude calculations that may affect the accuracy of the forecast.
Once the 14 day learning mode process is complete, the learning mode
icon will disappear and the weather forecast should be ready for superior
operation.
Atmospheric Pressure is defined as the pressure at any location on the
Earth, caused by the weight of the column of air above it. At sea level,
atmospheric pressure has an average value of one atmosphere and
gradually decreases as altitude increases. Also called barometric pressure.
The weight of the atmosphere that envelopes Earth exerts pressure on all
points of the planet's surface. Meteorologists use barometers to measure
this atmospheric pressure (also called barometric pressure). At sea level the
atmospheric pressure is approximately 1 kilogram per square centimeter
(14.7 pounds per square inch), which will cause a column of mercury in a
mercury barometer to rise 760 millimeters (30.4 inches). Variations in the
atmospheric pressure greatly affect the weather. Low pressure generally
brings rain. In areas of low air pressure, the air is less dense and relatively
warm, which causes it to rise. The expanding and rising air naturally cools,
and the water vapor in the air condenses, forming clouds and the drops
that fall as rain. In high pressure areas, the air is dense and relatively cool,
which causes it to sink. The water vapor in the sinking air doesnʼt condense,
resulting in clear skies.