Interface Statistics 3-7
Statistics
Adjust printer settings as required, then click OK. (For more information on the
appropriate printer settings, consult your Microsoft Windows UserÕs Guide.)
Interface Statistics
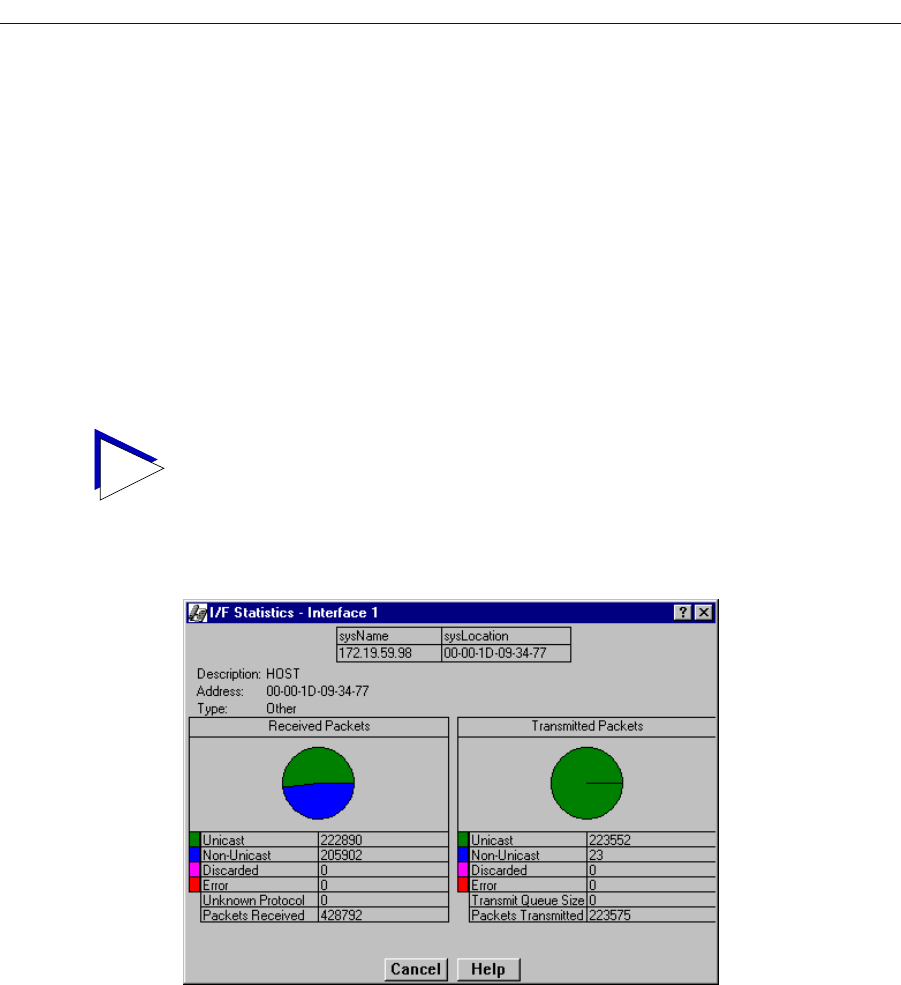
The Interface (IF) Statistics window (Figure 3-3) provides MIB-II interface
statistical information Ñ including counts for both transmit and receive packets,
and error and buffering information Ñ for any port interface which does not
support RMON, or whose RMON support has been disabled. A color-coded pie
chart in the middle of the window lets you graphically view statistics for Unicast,
Non-Unicast, Discarded and Error packets.
Figure 3-3. Interface Statistics Window
Three informational Þelds appear in the upper portion of the window:
Description
Displays the interface description for the currently selected port: Ethernet, FDDI,
or ATM.
Address
Displays the MAC (physical) address of the selected port.
TIP
This window is also available for all port interfaces Ñ regardless of their level of RMON
support or the current administrative status of the RMON Default MIB component Ñ
via the I/F Summary window (described in Chapter 2) or the bridge port menus in the
Bridge Status view (see the bridging chapter in your Tools Guide).