


Appendix E – 1910 Option 1K
E–2
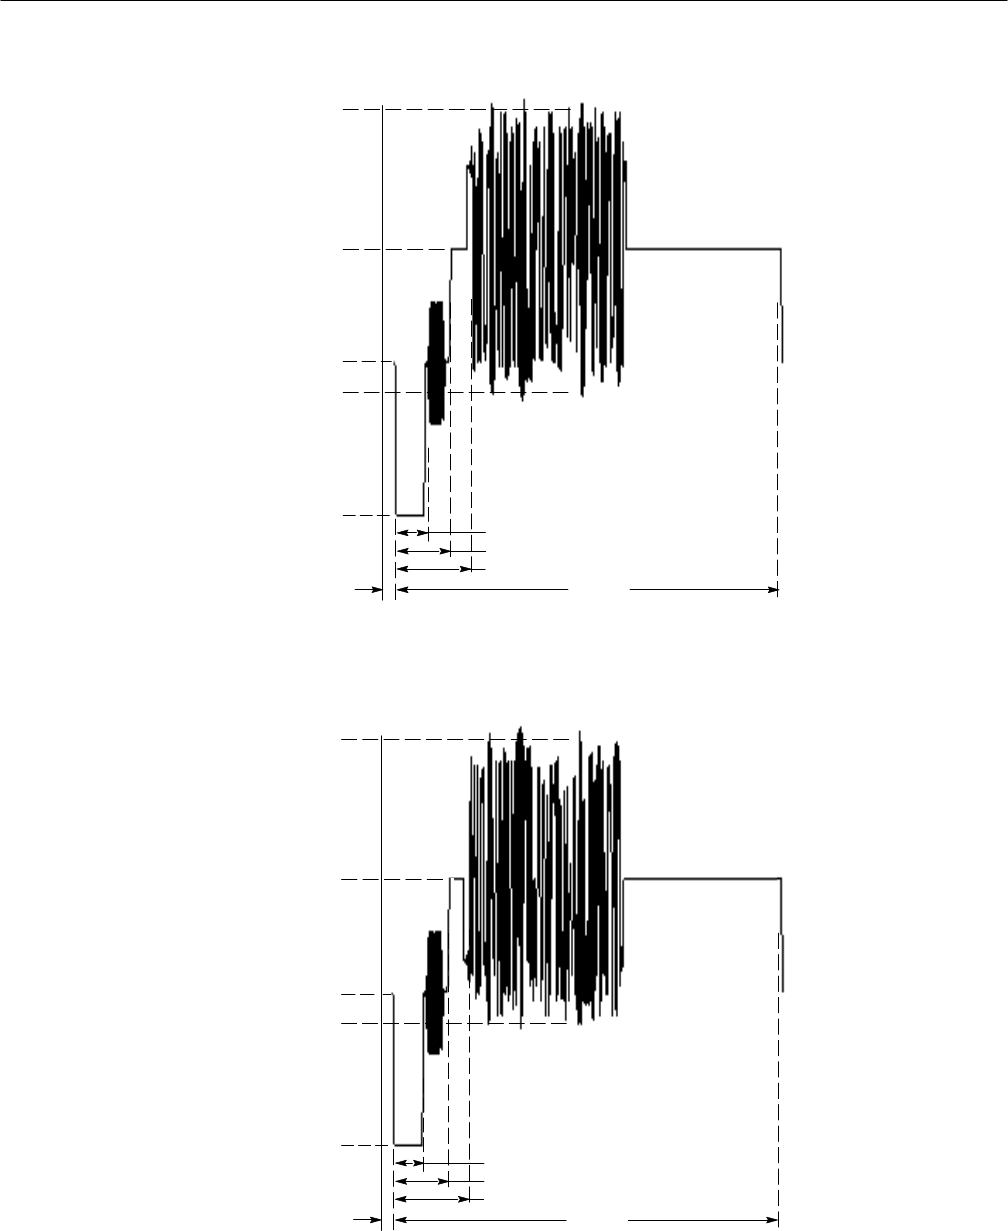
70
30
IRE
–10
–40
1.5 ms 61.9 ms
11.5 ms
8.75 ms
4.7 ms
0
Figure E–1: GCR positive test signal with amplitude and timing details
70
30
IRE
–10
–40
1.5 ms 61.9 ms
11.5 ms
8.75 ms
4.7 ms
0
Figure E–2: GCR negative test signal with amplitude and timing details