


18
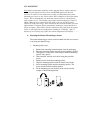
H. Barometric Air Pressure Reading
1. The actual barometric air pressure is displayed directly under the
weather forecast icon
2. The relative air pressure is calibrated by the user through the
programming mode.
3. Please Follow the programming instructions in section F of the
Detailed Set Up Guide to set this feature.
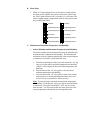
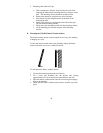
I. Air Pressure History Bar Chart
1. The bar graph shows in hPa (Hekto Pascal) the recorded air
pressure over the past 24-hours.
2. The horizontal axis shows the hours at increments of -24 hours, -18
hours, -12 hours, -9 hours, -6 hours, -3 hours, and 0 hours
(current).
3. The vertical axis is set by hPa: the “0” on this axis represents the
current hPa, and + or – 1,3,5, or 7 shows (in hPa) how high or low
the past air pressure was as compared to the current one.
4. The “0” on the vertical axis indicates the current air pressure value.
5. The “0h” on the horizontal axis indicates the current hour, thus the
current air pressure also.
6. Each bar on the bar graph represents a value of 0.03 hPa, and each
bar also has a corresponding value on the verticle axis.
7. Air pressure trends can be determined by simply glancing at the
bar graph.
a. If the bars are rising (higher on the right than the left) then the
air pressure has a rising trend, and the weather should
improve.
b. If the bars are dropping (lower on the right than the left) then
the air pressure has a falling trend, and the weather should
worsen.
8. Multiply the two values to find past air pressure (note the + or –
sign of values on the verticle axis); i.e. 0.03 hPa x 3 = 0.09 hPa,
now add this value to the air pressure (in LCD 4) to evaluate what
past air pressures have been.
9. The bar chart will constantly scroll to avoid burnout of the LCD.
Note:
This feature cannot be turned off.