


Model: 308-1425B www.lacrossetechnology.com/support Page | 12
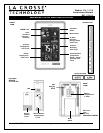
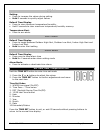
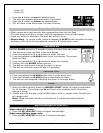
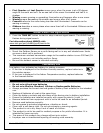
Forecast Tendency Indicators (Up, Right, Down Arrows)
Working with the forecast icons, the tendency indicators let you know if the weather is
improving, steady or worsening.
Rising Pressure Weather
is Expected to Improve
Steady Pressure Weather
is Expected to Stay the
Same
Falling Pressure Weather
is Expected to Worsen
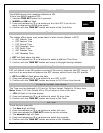
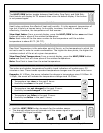
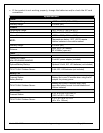
24 Hour Pressure History Graph/Tendency Arrows
The bar chart indicates the air pressure history trend over
the last 24 hours.
The columns represent the pressure change (”InHg” or “hPa”)
readings at specific times.
The “0” is equal to the current pressure and each bar
represents how past pressure was compared to the current
pressure.
Read the graph from left to right. If the bars are rising, it
means that the weather is getting better due to the increase
of air pressure.
If the bars go down, it means the air pressure has dropped and the weather is
expected to get worse from the present time.
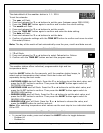
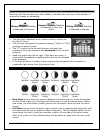
Moon Phase (based on lunar calendar)
New Moon occurs when the moon is between the earth and sun so the illuminated
portion of the moon is on the back side facing the sun and we cannot see it. After a
new moon, the illuminated (visible) portion will increase or wax until the full moon
occurs.
Full Moon occurs when the earth, moon and sun are in approximate alignment, with
the moon and the sun on opposite sides of the earth. The illuminated portion of the
moon faces the earth, giving us complete visibility of one side of the entire moon.
After a full moon, the illuminated portion will decrease or wane until the new moon
occurs.