


100912
WHAT MYGENFLEX SYSTEM BEST FITS YOUR NEEDS?
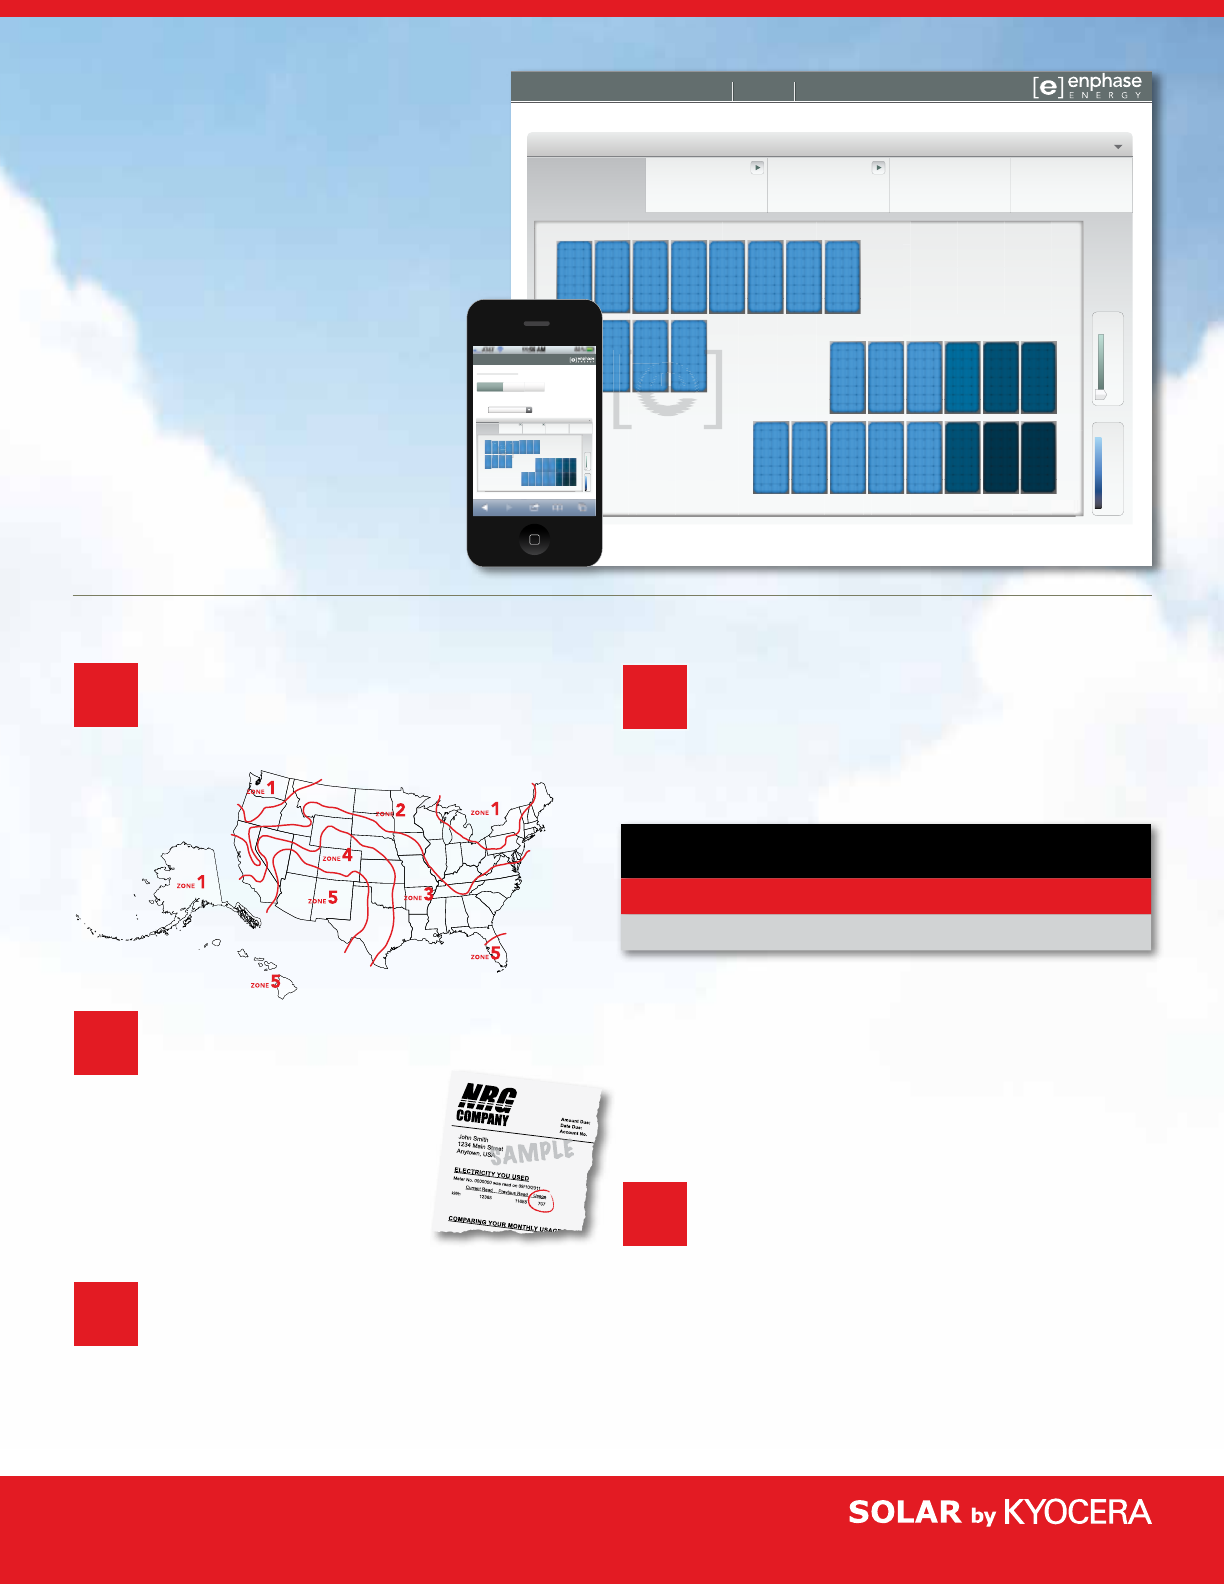
DETERMINE YOUR SUNLIGHT ZONE
Using this map, determine the zone in which
your installation will be located.
IDENTIFY YOUR AVERAGE DAILY
ENERGY CONSUMPTION
To identify your average daily kilowatt hours/
day (kWh/day) consumption, review your last
12 monthly electric bills. Most likely, your bill
will show monthly kWh usage. Simply add
the monthly kWh usage for all 12 bills and
divide the total by 365.
DETERMINE YOUR AVAILABLE SPACE
To determine the approximate available space, make
rough measurements of the length and width of your roof, or
ground space. The amount of available space will dictate the
maximum size of the system to install.
SELECT THE NUMBER OF BLOCKS
Use the chart below to determine the number
of MyGenflex blocks you will need to meet your average daily
energy consumption. Each block will require
approximately 77 square feet of available space.
Example:
Step 1 = Zone 3
Step 2 = 16.52 kWh average daily consumption
Step 3 = 400 square feet available
Blocks needed : 16.52/4.13 = 4
Space required: 4 x 77 sf = 308 sf < 400 sf space available
WORK WITH YOUR MYGEN DEALER
Now that you have an idea of which system may work
best for you, discuss the MyGenflex system with a dealer. A My-
Genflex dealer is fully qualified to help you through the selection
process as well as make sure you stay
within your budget.
To have an installer contact you directly, call 1-800-223-9580,
or send an email with your name and contact information to
mygen-info@kyocera.com.
KYOCERA Solar, Inc. 800-223-9580 www.kyocerasolar.com mygen-info@kyocera.com
enlighten
Overview
215
161.3
107.5
53.8
0
W
Zoom
Max
Min
Power Production
2.55kW
Today’s Peak 2.55 kW
Today’s Energy
6.44kWh
Past 7 Days
91.9kWh
This Month’s Energy
294kWh 8.66MWh
Lifetime Energy
12:10
17 Oct 11
GMT-0500
206
w
204
w
202
w
201
w
200
w
203
w
206
w
205
w
204
w
201
w
201
w
200
w
206
w
204
w
202
w
201
w
203
w
206
w
205
w
204
w
enlighten
SYSTEM ACCOUNT SUPPORT
202
w
201
w
205
w
204
w
202
w
201
w
205
w
204
w
201
w
200
w
201
w
200
w
201
w
201
w
200
w
200
w
205
w
204
w
205
w
204
w
enlighten
Overview
215
161.3
107.5
53.8
0
W
Zoom
Max
Min
Power Production
2.55kW
Today’s Peak 2.55 kW
Today’s Energy
6.44kWh
Past 7 Days
91.9kWh
This Month’s Energy
294kWh 8.66MWh
Lifetime Energy
12:10
17 Oct 11
GMT-0500
enlighten
Overview Graphs Events
Residential System
Petaluma, CA
6/12/2011 1:12 PM EDT
Array:
0 - 180˚
206
w
204
w
202
w
201
w
203
w
206
w
205
w
204
w
206
w
204
w
202
w
201
w
203
w
206
w
205
w
204
w
202
w
201
w
205
w
204
w
202
w
201
w
205
w
204
w
45
w
45
w
68
w
68
w
71
w
71
w
42
w
42
w
76
w
76
w
64
w
64
w
200
w
201
w
201
w
200
w
201
w
200
w
201
w
200
w
201
w
201
w
200
w
200
w
205
w
204
w
205
w
204
w
45
w
45
w
68
w
68
w
71
w
71
w
42
w
42
w
76
w
76
w
64
w
64
w
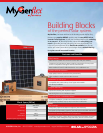
OPTIONAL MONITORING WITH
ENLIGHTEN FROM ENPHASE
The Enlighten monitoring software from Enphase
provides an unprecedented level of intelligence
to solar power system owners and installers. Unlike
conventional monitoring systems, which only
monitor the inverter, Enlighten is continuously
monitoring the health and performance of
each and every solar module and microinverter
in the array. Enlighten’s web-based analytics
will identify and alert owners and installers
to any deviation in performance, allowing for
quick and hassle-free maintenance.
Enlighten can also be accessed via a web-
enabled mobile device, allowing remote
troubleshooting and updates.
1
2
3
4
5
Average Daily Energy Production (in kWh/day)
of 1 (980 watt) MyGenflex block by sunlight zone
ZONE 5 ZONE 4 ZONE 3 ZONE 2 ZONE 1
4.62 4.28 4.13 3.85 2.78